All Activity
- Last week
-
 Legolas-1309 joined the community
 -
Köhler IB für TGA joined the community
- Earlier
-
ageffCK joined the community
-
V_TimS joined the community
-
Hi RSANZ, you can find the diagram editor on the "results" page, please refer to our help pages to find out more: https://help.valentin-software.com/pvsol/en/pages/results/diagram-editor/ Or in Spanish: https://help.valentin-software.com/pvsol/es/paginas/resultados/editor-de-diagramas/ Hope that helps, kind regards, Martin
-
Where exactly can I check it after the simulation?
-
Ella joined the community
-
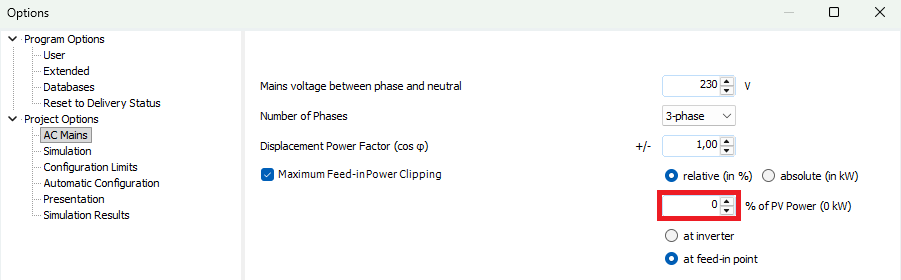
Hello RSANZ, you can set the feed-in limit to 0 so that nothing is fed back into the grid. Currently there is no option to limit the power that can be drawn from the grid, however. But you can see in the results after the simulation how much power has been drawn when, as a time series or carpet plot. That'd help to investigate if the system behaves as intended. Best, Martin
-
Hi PVJames, thank you for reporting this. We already know of this behaviour, the percentages relate to single days as you already suspected. So if evenly distributed as in your first example, you'll have 31 portions in January and only 28 in February. See this thread here, there is an Excel sheet where you can prepare your data accordingly if you want to have an equal monthly percentage: We have planned to add this as an option to the dialog, so that users can choose between the daily and the monthly approach. Best, Martin
-

Altanlage soll von Volleinspeisung auf Eigenverbauch umgestellt werden
developer_mh replied to Raffael PV's topic in PV*SOL
Hallo, interessanter Fall! Ersteres geht, ja. Ist auch sehr einfach. Aber noch einfacher wäre, das über den Simulationsparameter Verschmutzung zu machen: Beste Grüße, Martin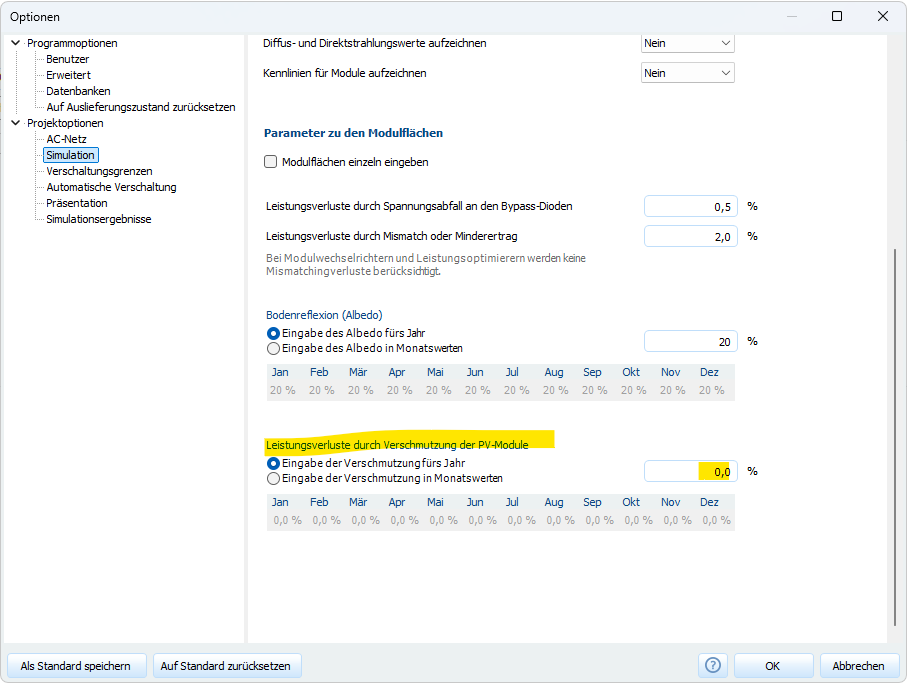
-
Good morning. I would like to know how to configure the program to simulate a 300 kW grid connection limit and ensure that no energy is fed back into the grid. In other words, it can only draw 300 kW from the grid and cannot feed any power back into it.
-
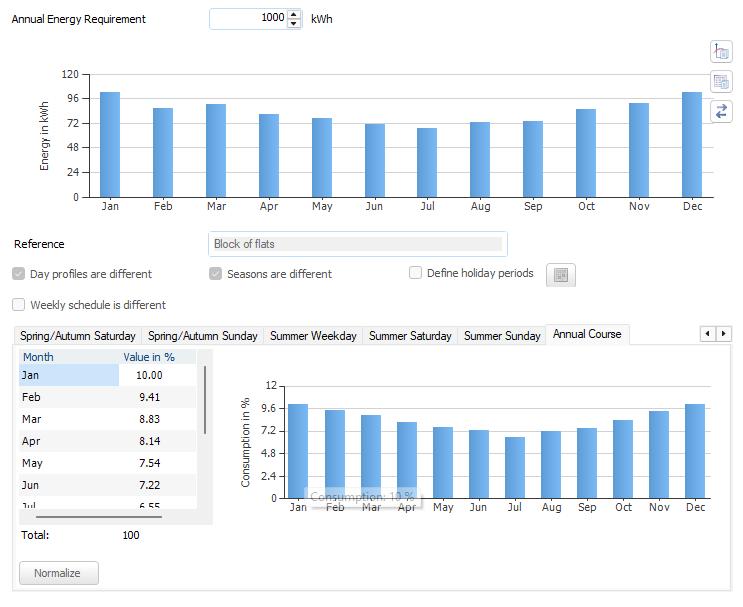
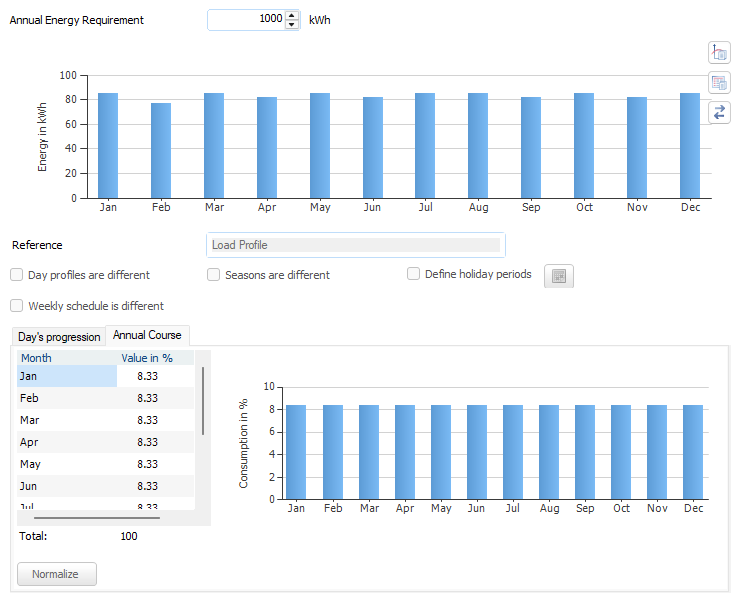
I recently noticed that the load data for consumption seems to not match the provided data, as in the annual course table that you can edit does not match the consumption graph shown above, I have attached two screenshots showing the issue, one user inputted, with all months and days being identical, and Brazil/Block of flights to show that the error applies to both default and user-input data. My guess is a calculation issue, as the output data seems to be higher on months with 31 days and lowest in February with the fewest days. Any help is appreciated on either fixing the bug or making a load profile to counter the issue, it's only a 3% difference but that can make the difference in some projects.
-
Hallo zusammen! Ein Kunde von uns hat zwei Dächer seit etwa 20 Jahren für zwei PV-Anlagen verpachtet. Diese fallen zeitnah aus der Einspeisevergütung aus. Der Pächter würde diese Altanlage unserem Kunden überlassen. Dieser hat einen hohen Stromverbrauch, wodurch er sich wünscht, dass wir den Ertrag und damit den Eigenverbrauch dieser Anlage, als auch einer Repowering Option einmal simulieren. Nun ist die Frage wie ich mit den alten Modulen umgehe. Gibt es einen einfacheren Weg, als ein bestehendes Modul zu kopieren und mit nur 80% der Modulleistung zu simulieren oder kann man die Moduldegradation mit 80 beginnen lassen? Zugriff auf Ertrags- oder Einspeisewerte haben wir aktuell nicht. Viele Grüße
-
Current & Voltages not showing in Export Simulation Results
developer_mh replied to Cameron.H.04's topic in PV*SOL
Hi Cameron, could you send us a project file where this happens? Please send it to hotline@valentin-software.com, along with a link to this forum post. Thanks a lot, kind regards, Martin -
Hallo, auch ich konnte nach Kollision eines zu pflanzenden Baumes mit einer unsichtbaren gesperrten Grundfläche meines 3D-Models (.obj) neue Objekte (Bäume) wieder näher am Haus frei platzieren.
-
Been having an issue with the PVSOL export simulation results where the simulation results aren't showing the tab labelled "Current & Voltages". This hasn't been an issue previously, and even on more recent projects I've managed to get this info per inverter just fine. I've attempted clearing some of the error messages on the design (feed-in and grid tariff, dimensioning factors, etc.) to no avail neither. Now I'm thinking that maybe its a case of having too many inverters in the design itself? Not entirely sure. Any help with this would be greatly appreciated.
-
I made sketch of diagram. So, there is no solution for new regulation, the surplus feed-in billing method in Croatia?
-
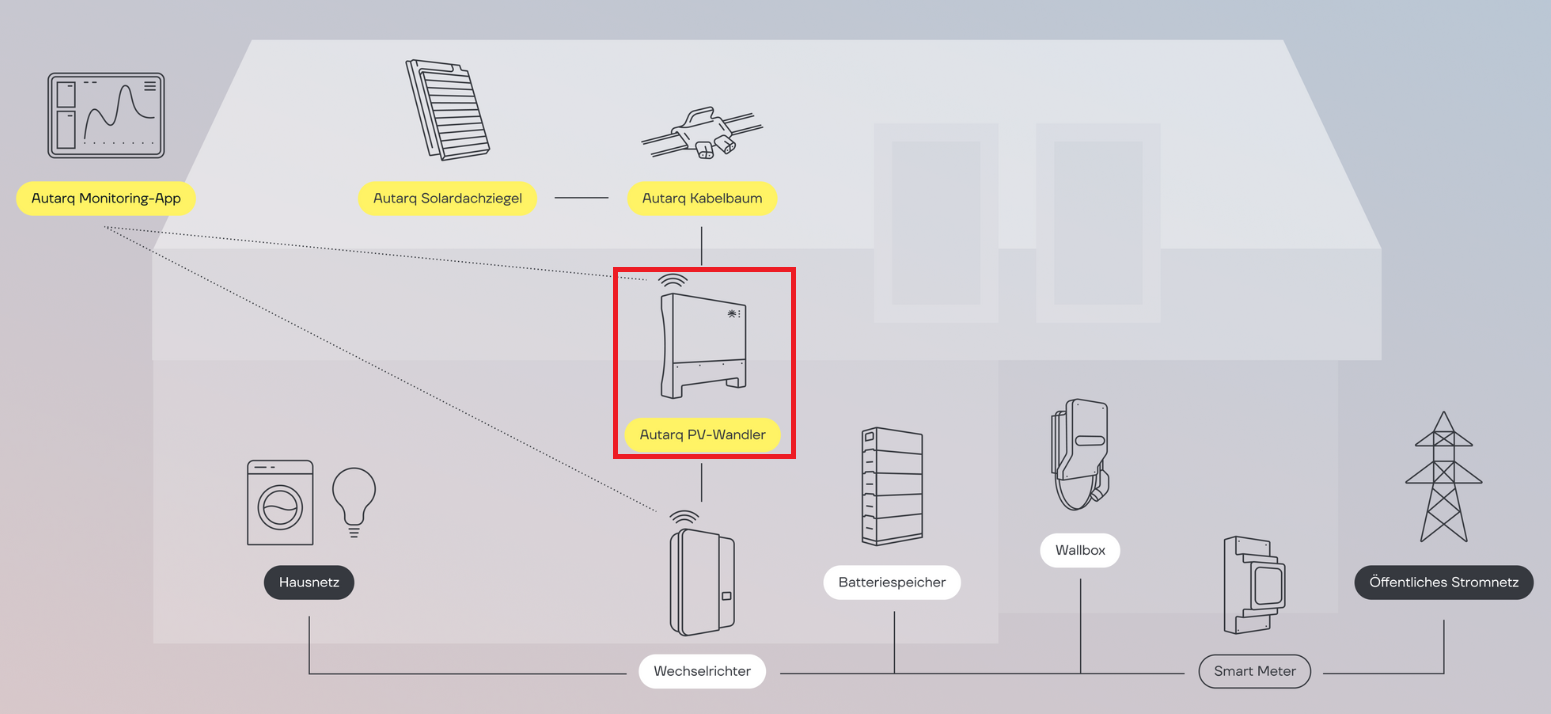
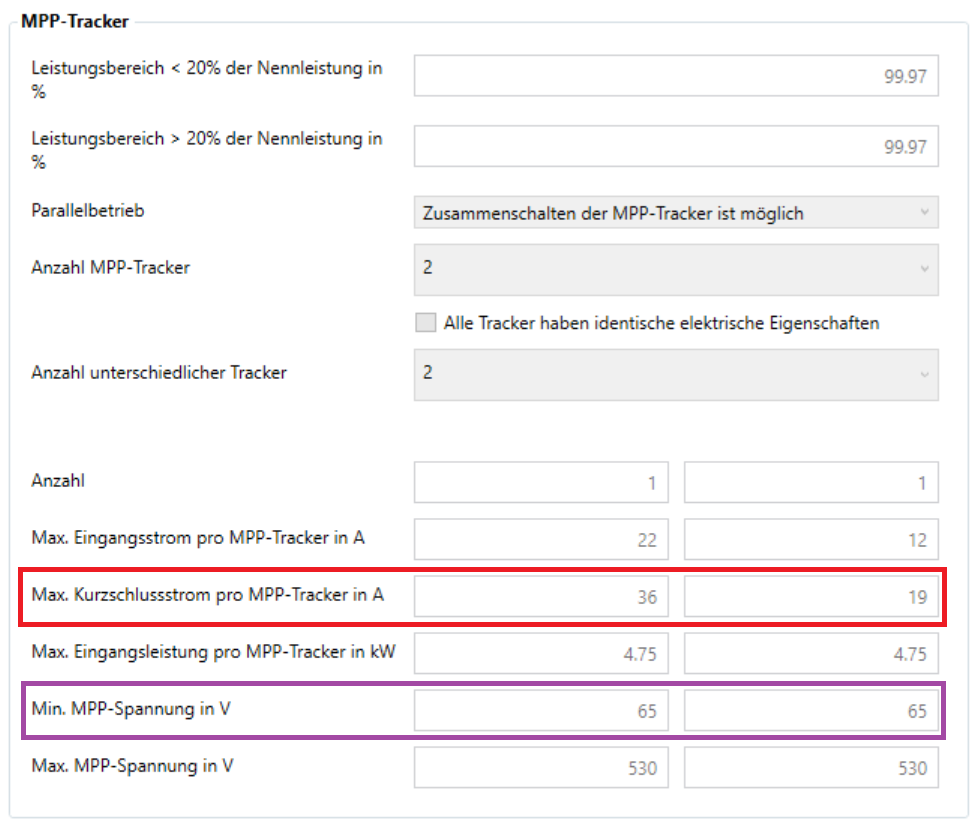
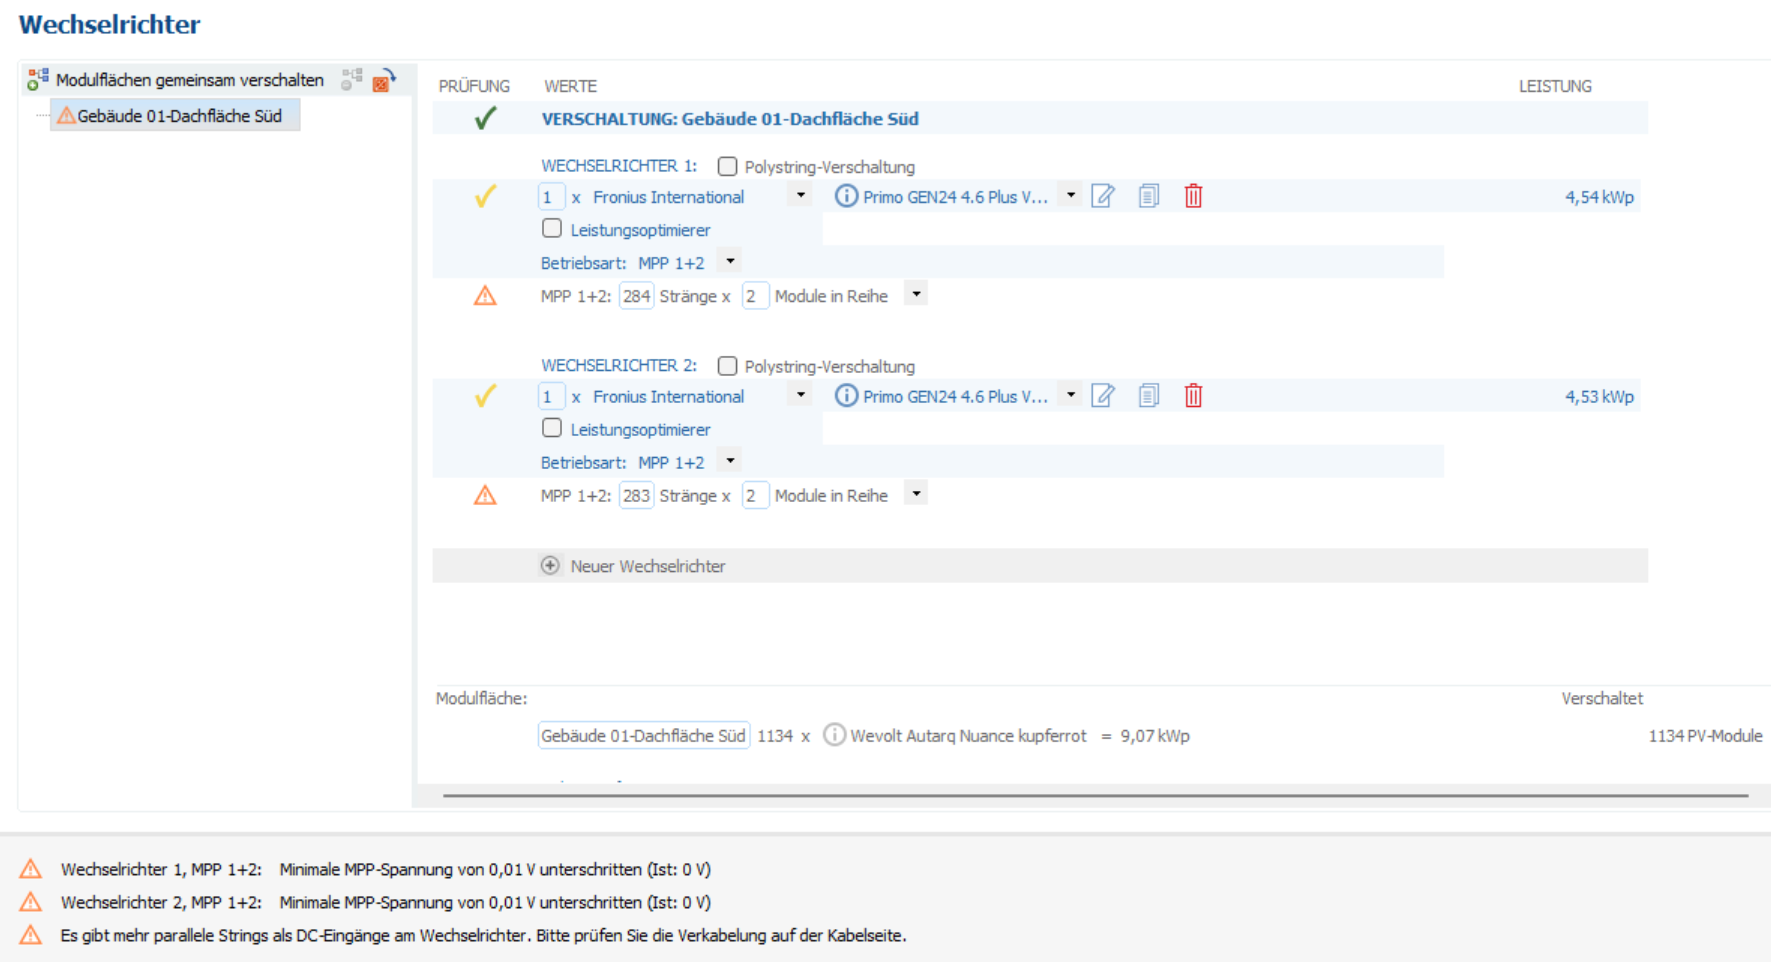
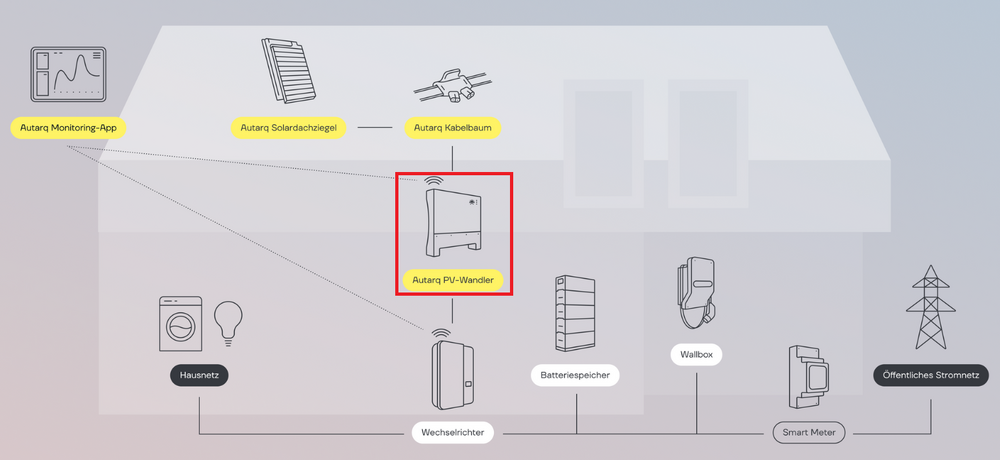
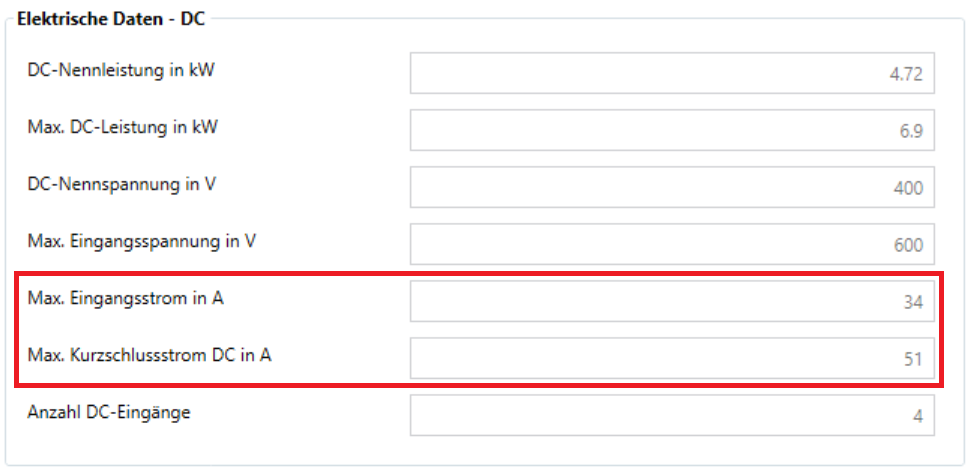
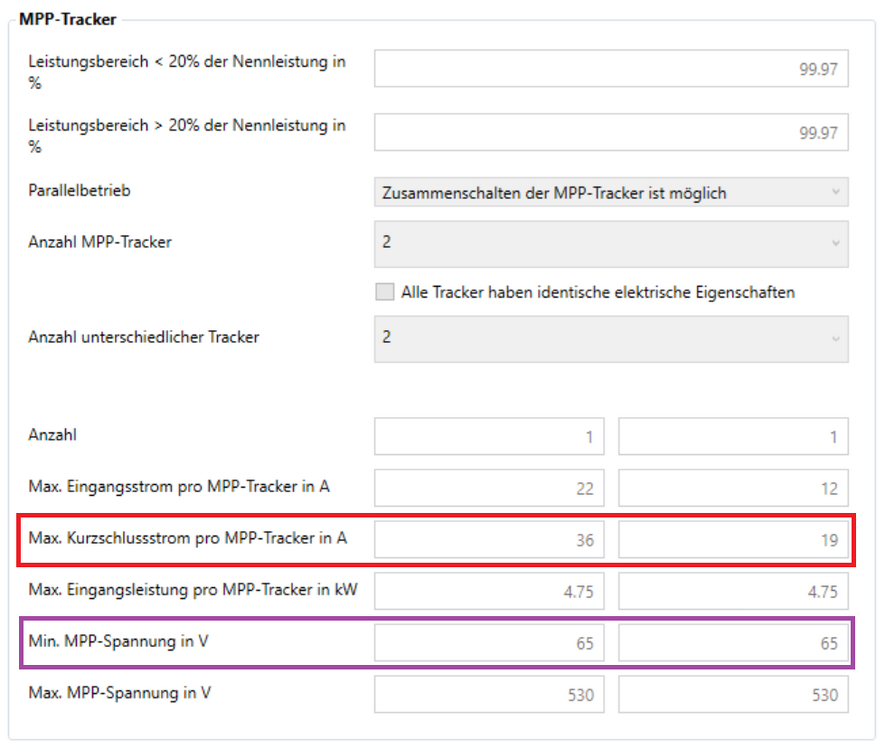
Vielen Dank für die Zusendung der Projektdatei und des Datenblatts. In einem Autarq-System werden nicht alle Ziegel parallel verschaltet, sondern immer zwei Ziegel in Reihe. Dadurch verdoppelt sich die Nennspannung von 41 V auf 82 V und die Leerlaufspannung von 49 V auf 98 V. Zwischen den Solarziegeln und dem Wechselrichter befindet sich ein PV-Wandler, an dem je zwei in Reihe geschaltete Ziegel parallel verschaltet werden. Der PV-Wandler wandelt die von den zwei in Reihe geschalteten Ziegeln erzeugte Gleichspannung (60-120 VDC) in die Eingangsspannung für den Wechselrichter (200-450 VDC) um. Dabei werden gleichzeitig die hohen Stromstärken in den passenden Eingangsstrom für den Wechselrichter umgewandelt. Bedauerlicherweise kann der PV-Wandler in PV*SOL premium nicht abgebildet werden. Sie können sich möglicherweise behelfen, indem Sie den Datensatz des Wechselrichters kopieren und so anpassen, dass die elektrischen Eigenschaften des PV-Wandlers (niedrigere Eingangsspannung, höherer Eingangsstrom) mit berücksichtigt werden. Die Verschaltung könnte so aussehen: Die Simulation kann durchgeführt werden, aber dass die Simulationsergebnisse realistisch sind, können wir nicht garantieren, da auch der PV-Wandler Verluste verursacht, die nicht berücksichtigt werden.
-
Guten Tag, vielen Dank für Ihre Anfrage. Welche Ziegel und welchen Wechselrichter wollen Sie verwenden? Damit eine reine Parallelschaltung möglich wäre, müssten die Ziegel hohe Spannungen und niedrige Stromstärken haben. Außerdem müsste der Wechselrichter in einem niedrigen Spannungsbereich arbeiten und hohe Stromstärken zulassen. Bitte senden Sie uns die Projektdatei (*.pvprj) an hotline@valentin-software.com, dann sehen wir uns das an.
-
Ich plane eine dachintegrierte PV-Anlage mit Solarziegeln. Diese werden parallel verschalten. Wie erstelle ich die Parallelverschaltung aller Ziegel in PV*Sol? Ich finde bei den Belegungsvarianten keine Auswahlmöglichkeit und mit der Wechselrichterauswahl kann ich nur bis auf 3 Module in Serie verschaltet runtergehen. Danke!
-
 Dear Mona, Thank you for your message. Yes, it is possible to combine both, for example: But with around 60 strings and a 500 kW inverter, such as the one you intend to use, things might get a bit confusing. Without Polystring configuration, you can keep track of everything, as the configuration is simply 60 × 19 modules. With Polystring configuration, each string is listed individually and you must take care not to mix up the numbering and order of the strings.
-
Hello, Thank you for your inquiry. We have sent you a message with the download link. Instructions on how to release the serial number can be found in our FAQ.
-
Hello, Is there a way to download 2025 R4? I still have previous licensing and I would like to switch from old device to new one. Thanks in advance
-
Hello, thank you for your explanation. Now my question is about combining both cases in the same inverter configuration. In my project, some existing strings are already connected in parallel as 2er groups, and I would like to keep these parallel groups unchanged. At the same time, after removing one module row, some other 19-module strings have to be built across several separate roof areas. Is it possible to model both situations in the same inverter configuration? If yes, how should I do it? If not, what workaround do you recommend? Best regards, Mona
-
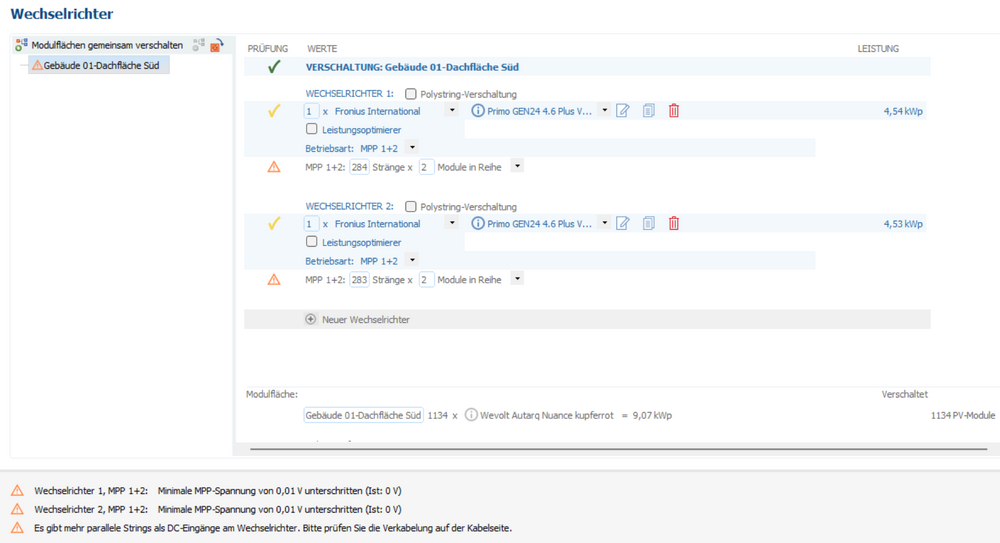
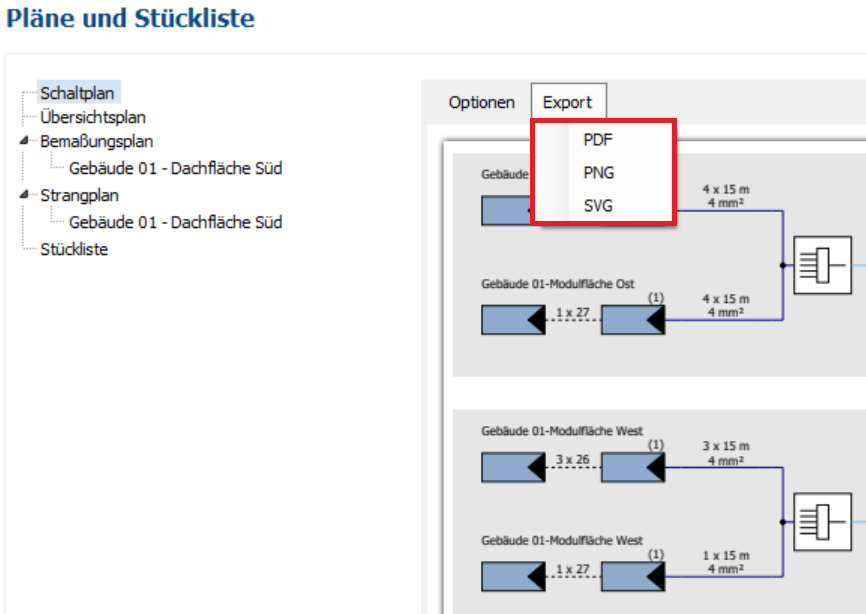
Hallo Tim, vielen Dank für die Zusendung der Projektdatei. Es handelt sich um einen Bug. Unsere Entwicklungsabteilung arbeitet an einer Lösung. Kurzfristig hast du leider nur die Möglichkeit, den Schaltplan zu exportieren und die Kabelanzahl in einem Bildbearbeitungsprogramm anzupassen.
-
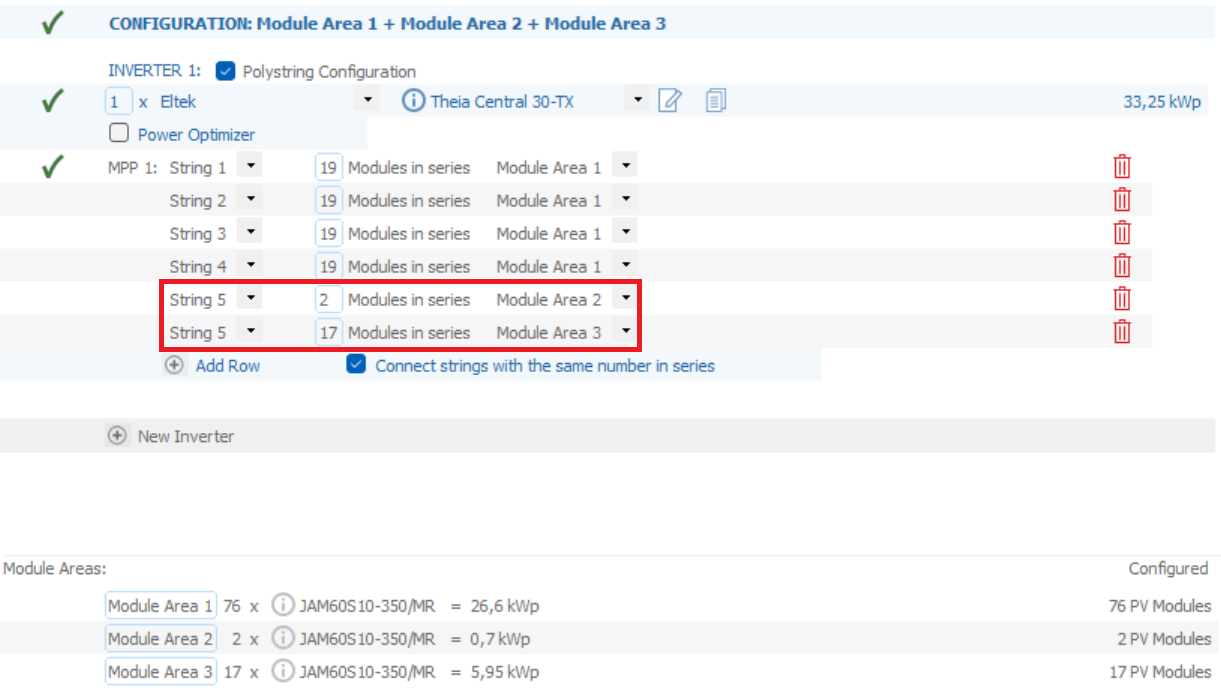
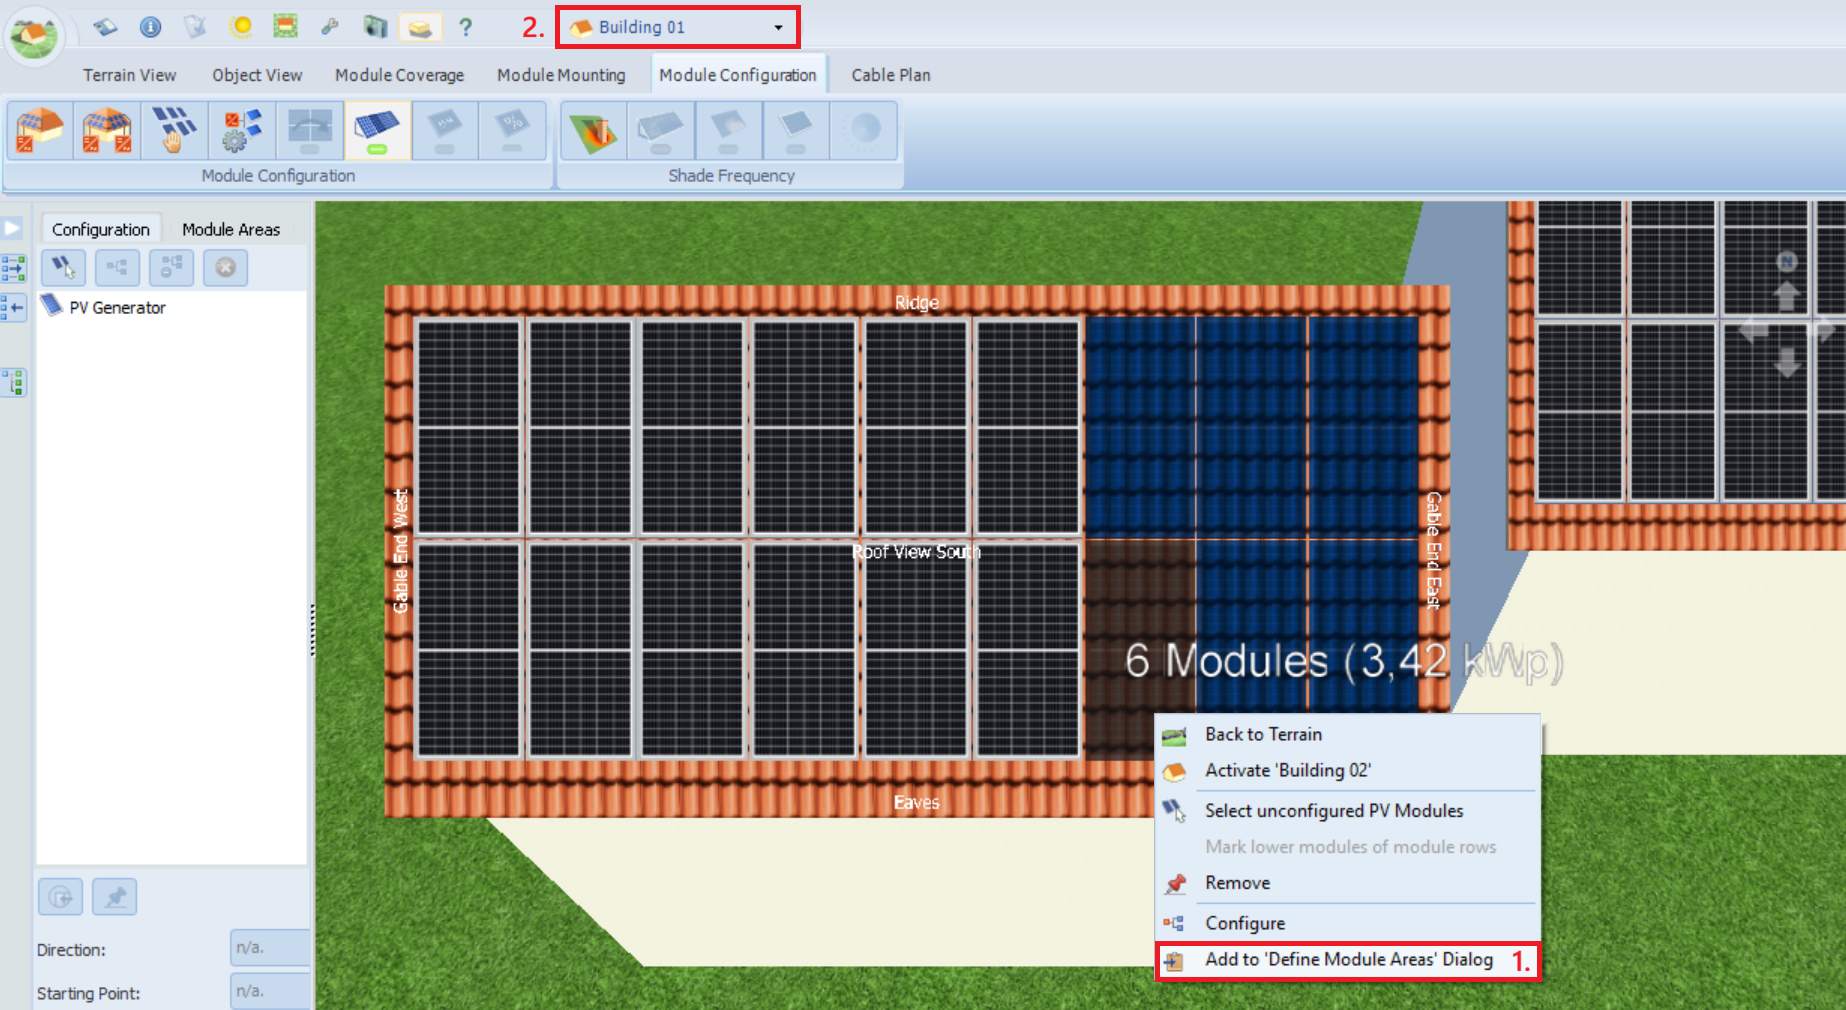
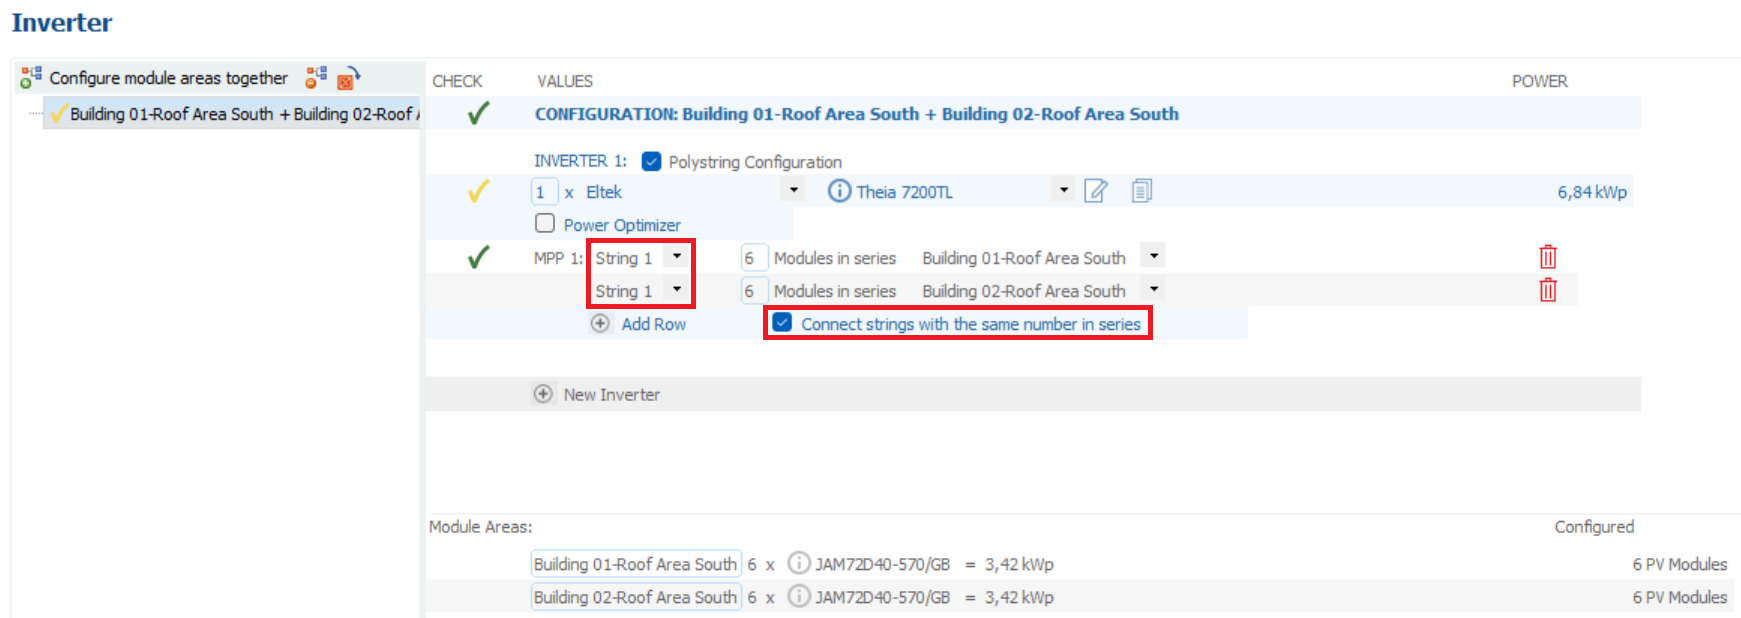
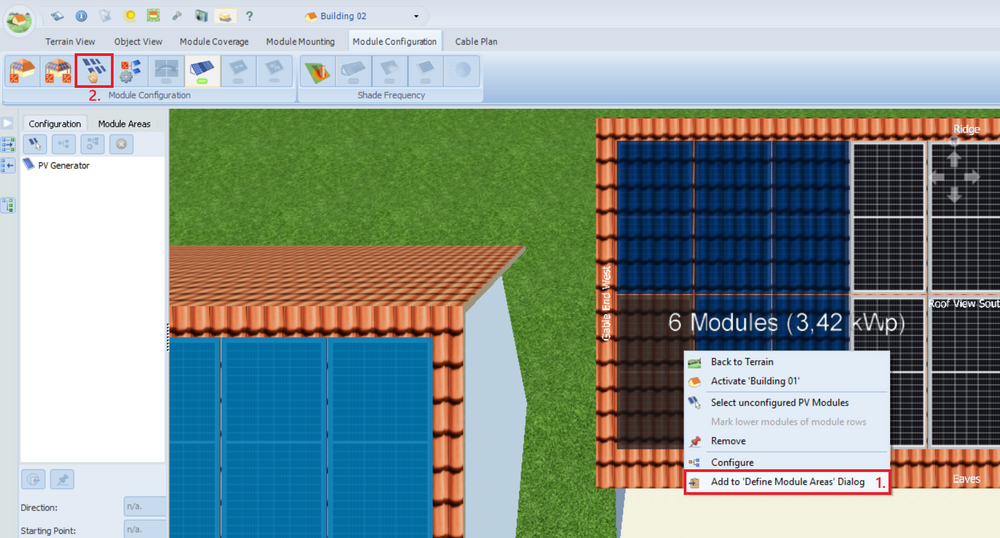
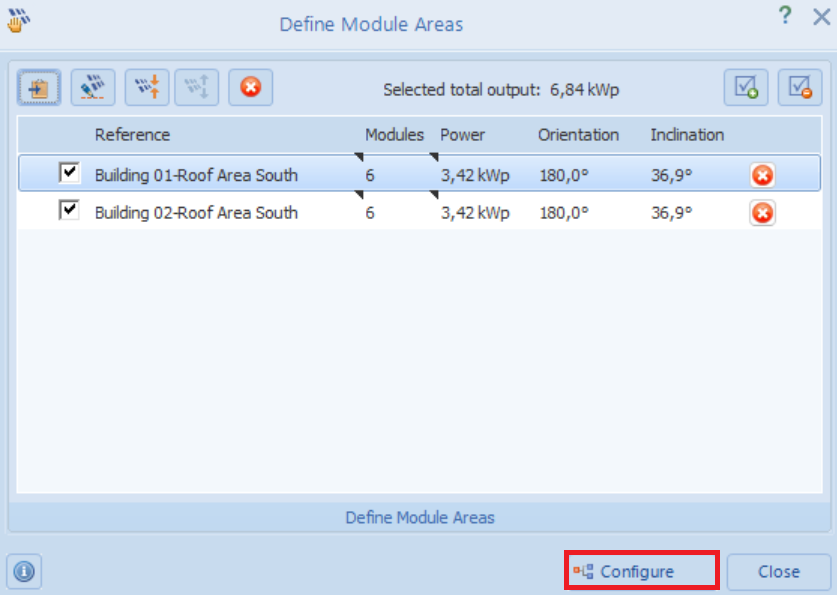
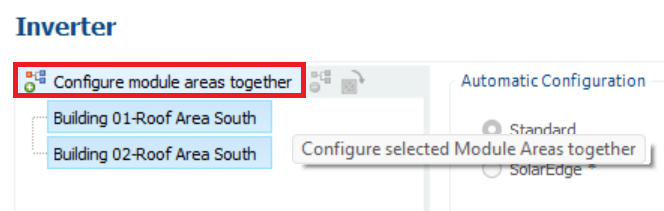
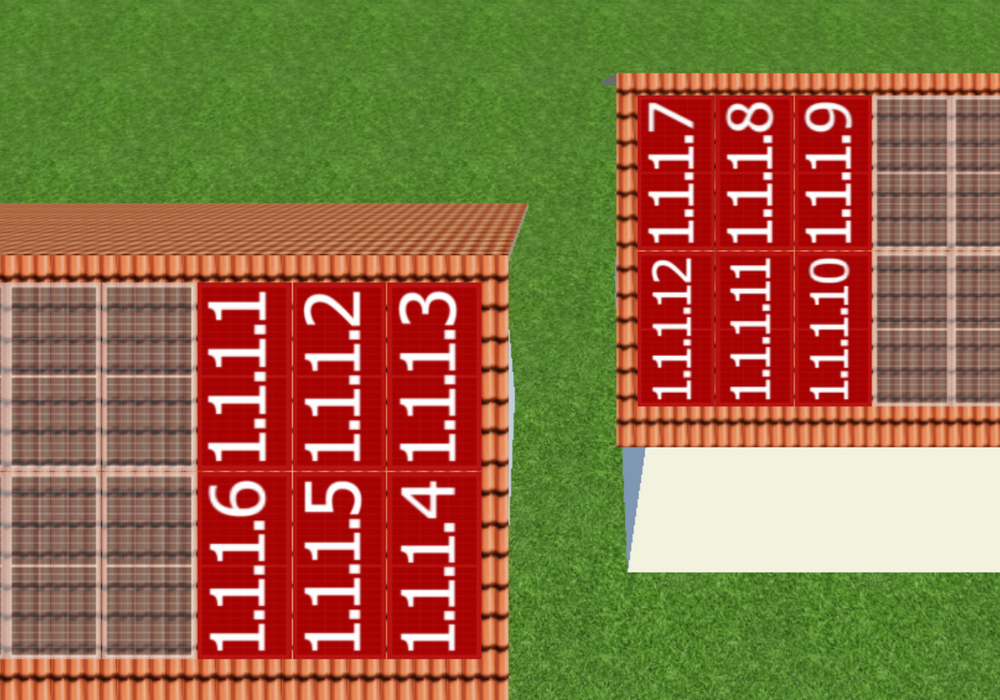
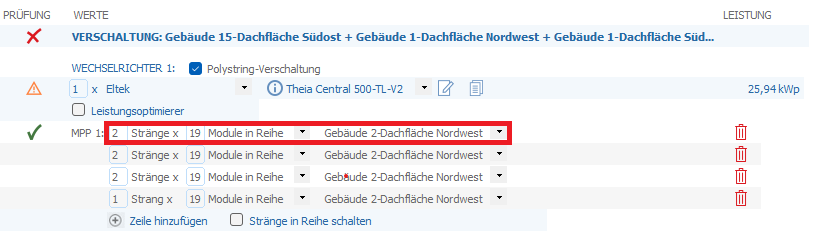
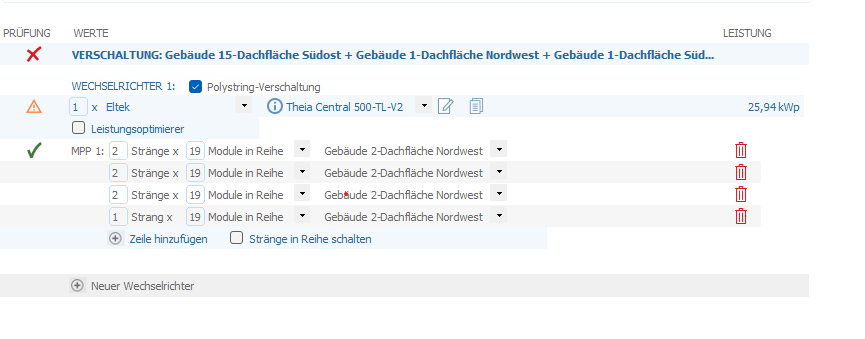
Hello, Thank you for your inquiry. You can configure multiple module areas on different roof areas together. First, define which modules should be configured together. Select the desired modules from the first module area, right-click on the selected modules, and choose "Add to 'Define Module Areas' Dialog." Then use the dropdown menu in the top menu bar to switch to the second building. Now select the desired modules of the second module area, right-click on the selected modules, and choose "Add to 'Define Module Areas' dialog." Then click the "Define Module Areas for Configuration" button: You can rename the module areas if necessary (right-click → Rename). Then click "Configure": In the inverter configuration window, select both module areas and click "Configure module areas together": Select both checkboxes for "Polystring configuration" and "Connect strings with the same number in series," and assign both module areas to string 1: String 1 now runs across two separate roof areas: You have already implemented the parallel configuration of two strings, each with 19 modules, on the same roof area:


-
Hello everyone, I am redesigning the string layout of an existing PV system after removing some modules. The physical module layout should remain as close as possible to the existing installation. In the new design, every string must have exactly 19 modules in series. I have two separate questions: 1. Some 19-module strings have to run across several separate roofs. The roofs have the same tilt and orientation. Is it possible in PV*SOL to define one electrical string whose modules are placed on different separate roofs? 2. Independently from that, some strings have to be connected in parallel, for example two separate strings with 19 modules each as one parallel string group. How should this be modelled correctly in PV*SOL? The strings crossing several roofs are not necessarily the same strings that are connected in parallel. My main question is: Can PV*SOL handle both cases in one project, while keeping the real physical module placement as much as possible? If this is not possible directly, what would be the recommended workaround for a realistic yield comparison? Thank you very much for your help.
-
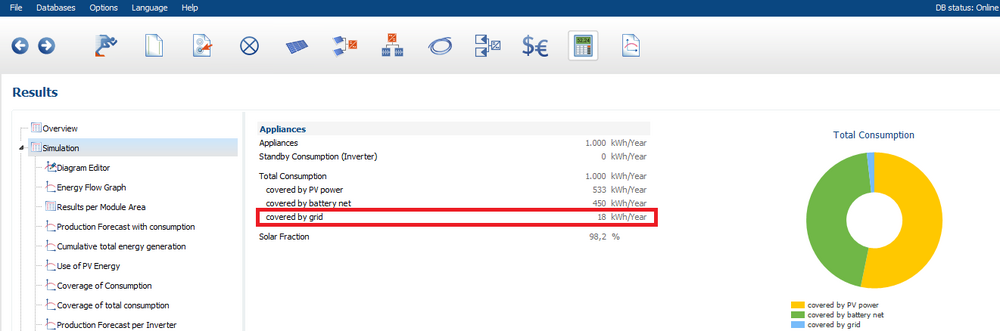
Hello, Thank you for your inquiry. On the "System Type, Climate and Grid" page, you can select the "Stand-alone PV System" (with and without a backup generator) system type. Planning stand-alone systems in PV*SOL is based on the SMA Off-Grid Configurator program, which we originally developed for SMA. This program contains the design rules that SMA has specified for us. These rules cannot be changed or deactivated. For example, only systems with AC-coupled battery systems can be planned; DC systems are unfortunately not possible. We understand that these rules may not necessarily apply to other manufacturers and may entail further limitations. For greater flexibility in component selection and improved transparency during the planning process, we recommend that you initially plan your stand-alone system as if it were a grid-connected system: On the "System Type, Climate and Grid" page, select a grid-connected system. Set the feed-in limit to zero; then no energy will be fed into the grid: The value under "Total consumption covered by grid" indicates the energy that cannot be covered by the PV system. This energy must be provided by the backup generator or (if you are not planning on a backup generator) "approach zero".
-
Advice needed – modeling a complex multi-plane roof in PV*SOL (beginner)
hotline_oh replied to Greentechbau's topic in PV*SOL
Hello, Thank you for your message. Registration on the Rexplorer website is not required. You can generate an API key within the PV*SOL premium 3D environment. If you do not yet have an API key for Rexplorer, or if you have not yet entered it in PV*SOL premium, only the button for managing the API key will appear. Clicking the button will take you to the window where you can manage the API key. In this dialog, you can manage your Rexplorer API key. If you don’t have a Rexplorer API key yet, simply leave the API key field blank. An account will then be automatically created on Rexplorer using the email address displayed above, and an API key will be generated. When you sign up, your email address will be transmitted to Rexplorer’s servers. Rexplorer’s Privacy Policy and Terms of Use apply. If you already have an API key from Rexplorer, you can simply enter it here. If you have forgotten your API key, you can retrieve it in the Rexplorer portal. You can find further information about the Rexplorer API and managing the Rexplorer API key in our help section. -
Hallo Tim, vielen Dank für deine Anfrage. Bitte sende uns die Projektdatei (*.pvprj) an hotline@valentin-software.com, dann sehen wir uns das an.