hotline_oh
-
Posts
593 -
Joined
-
Last visited
-
Days Won
31
1 Follower

About hotline_oh

hotline_oh's Achievements
")


-

Einspeisevergütung pro Jahr und Betrag der jährlichen Netzeinspeisung
hotline_oh replied to Philipp IW's topic in PV*SOL
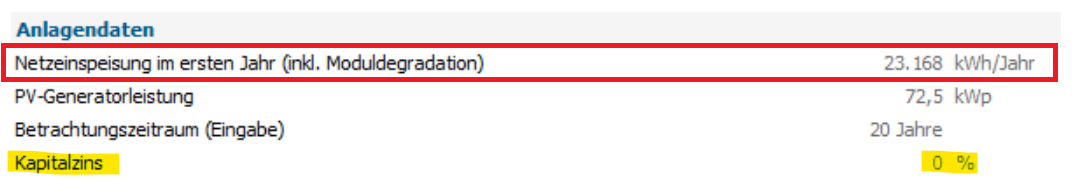
Hallo Philipp, vielen Dank für die Zusendung der Projektdatei. In den Simulationsergebnissen wird die theoretisch maximal mögliche Netzeinspeisung angezeigt (31.200 kWh/Jahr) und in der Wirtschaftlichkeit die tatsächliche (23.168 kWh/Jahr), abzüglich Moduldegradation, Standby-Verbrauch des Wechselrichters und Nichteinspeisung (Solarspitzengesetz). In der Wirtschaftlichkeit haben Sie 475 Stunden mit negativem Strompreis berücksichtigt. Die Unterschiede in der Netzeinspeisung sind auf die Stunden mit negativem Strompreis zurückzuführen, in welchen nicht eingespeist werden darf.
-
Unterschiedliche Tarife Sommer / Winter für die Einspeisevergütung
hotline_oh replied to Sinä's topic in PV*SOL
Hallo Sinä, wir beziehen uns noch einmal auf deine Anfrage. Es können vZEV und LEG wie eine Mieterstromgemeinschaft abgebildet werden, solange nur eine einzige Erzeugungsanlage existiert. Du kannst zwar beliebig viele Verbraucher (mit unterschiedlichen Bezugstarifen) simulieren. Es ist jedoch im Moment noch nicht möglich, mehrere Erzeugungsanlagen (mit unterschiedlichen Einspeisetarifen) zu berücksichtigen. -
Einspeisevergütung pro Jahr und Betrag der jährlichen Netzeinspeisung
hotline_oh replied to Philipp IW's topic in PV*SOL
Hallo Philipp, vielen Dank für deine Nachricht. Bitte sende uns die Projektdatei (*.pvprj) an hotline@valentin-software.com, dann sehen wir uns das mal an. -
Dear Anacleto Bunga, Thank you for your inquiry. In our help section you will find detailed instructions on how to create tariffs (English: From-grid tariffs, Feed-in tariffs, Net-metering tariffs; Spanish: Tarifas de compra, Tarifas de inyección, Tarifas Net-metering).
-
SMA STP 10.0 3SE40 DC-Eingangsbereichsüberschreitung
hotline_oh replied to dw12623's topic in PV*SOL
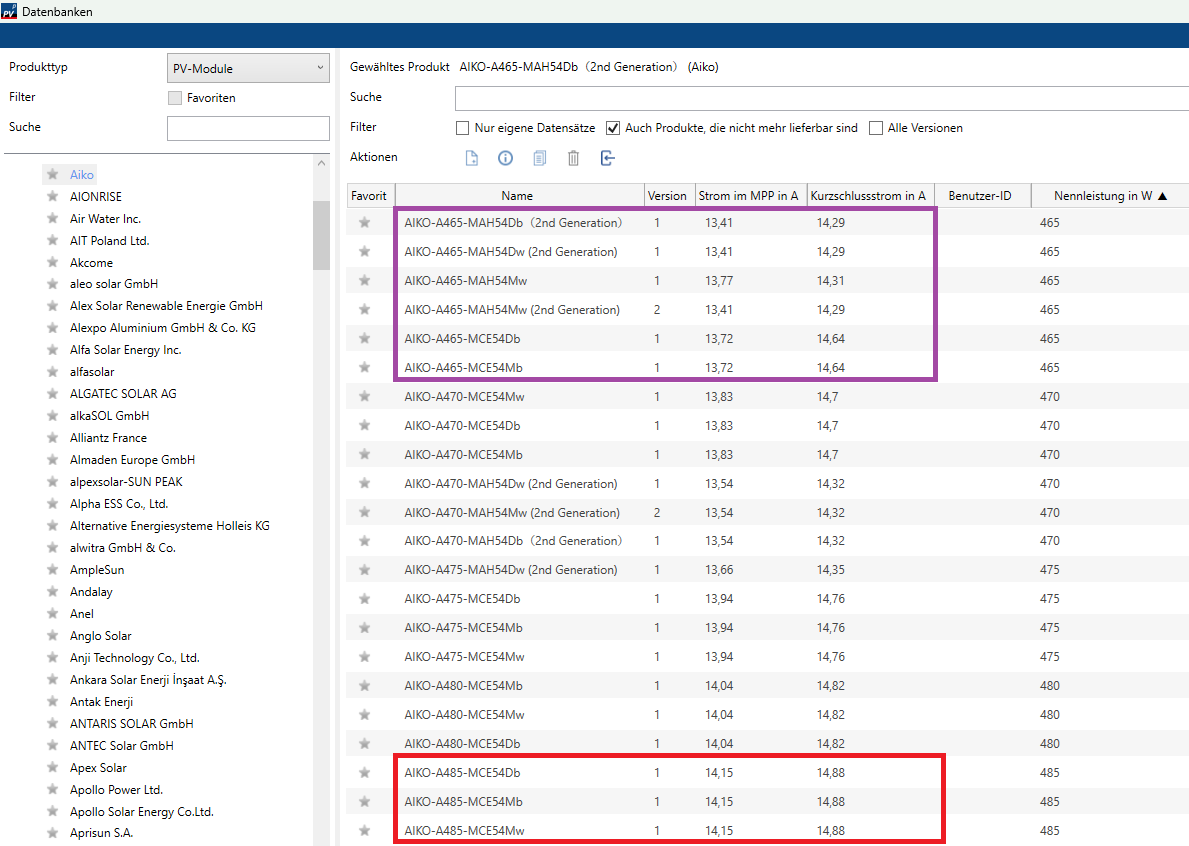
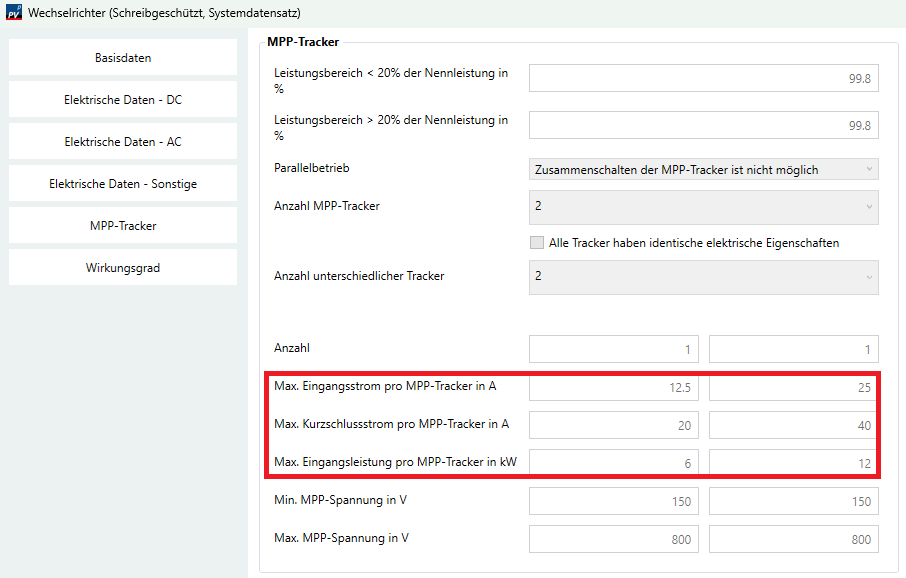
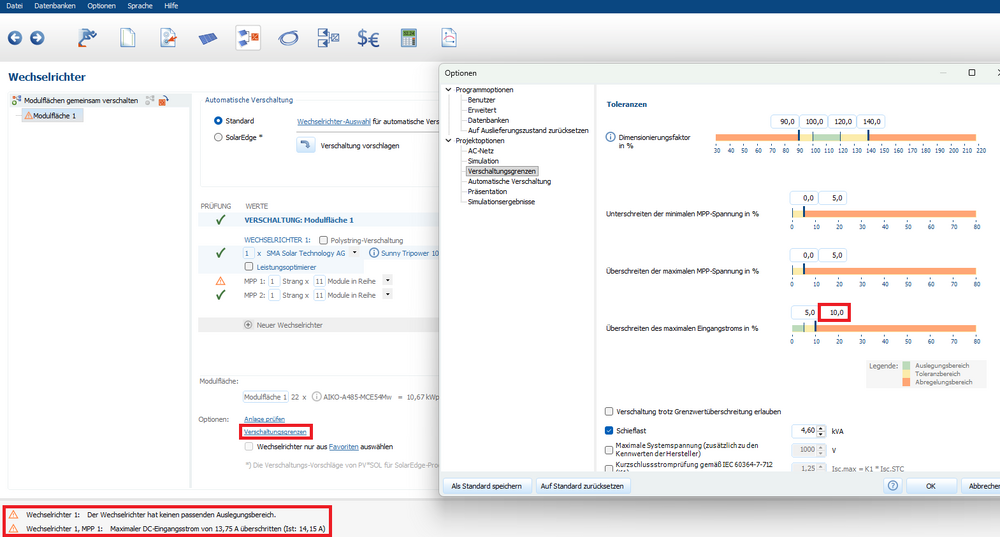
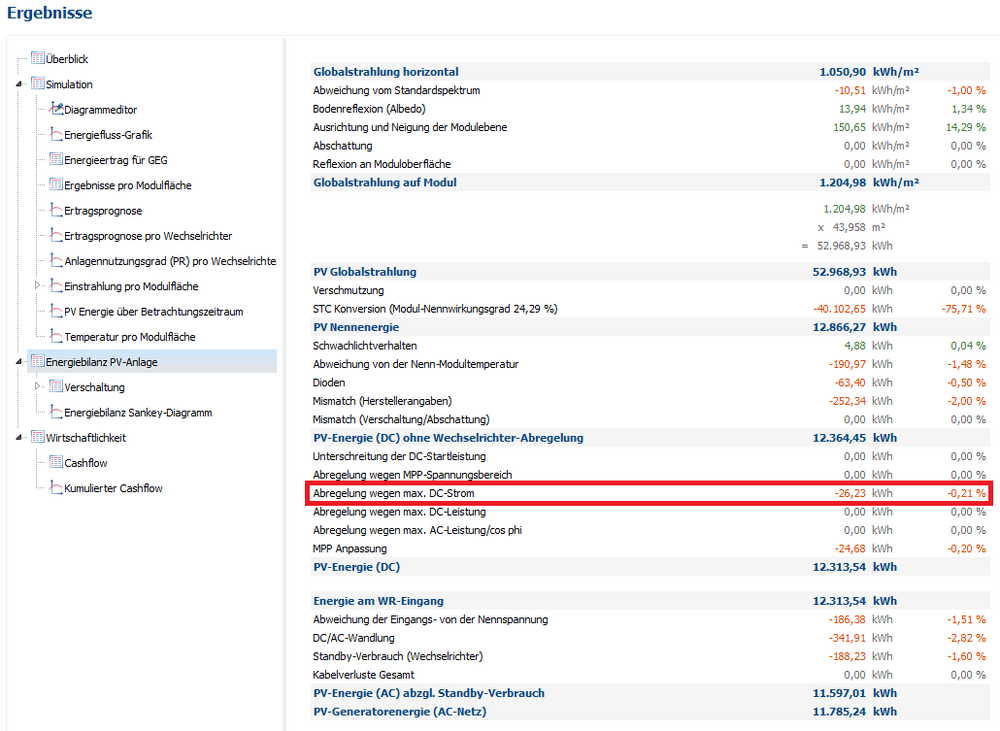
Hallo, vielen Dank für deine Anfrage. Die Wechselrichter SMA Sunny Tripower Smart Energy 10.0 und SMA STP 10.0 3SE40 sind identische Geräte, es handelt sich nur um eine andere Bezeichnung. STP steht für Sunny Tripower und SE steht für Smart Energy. Die beiden MPP-Tracker dieses Geräts haben unterschiedliche elektrische Eigenschaften. Der zweite MPP-Tracker kann doppelt so viel Leistung aufnehmen wie der erste. An den zweiten MPP-Tracker können zwei parallele Strings angeschlossen werden, an den ersten nur einer. Wir nehmen an, dass du Aiko-Module der Leistungsklasse 485 Wp (nicht 465 Wp) verwendest, denn die 465-Wp-Module haben niedrigere MPP- und Kurzschlussströme, hier käme es nicht zu dem von dir geschilderten Problem: Der maximale MPP-Eingangsstrom des Wechselrichters beträgt 12,5 A am MPPT 1, das Modul hat jedoch einen MPP-Strom von 14,15 A. Deshalb gibt die Software eine Warnmeldung aus. Unter "Optionen" --> "Verschaltungsgrenzen" kannst du sehen, welche Toleranzbereiche eingestellt sind. Der MPP-Strom von 14,15 A überschreitet den 10-prozentigen Toleranzbereich. Wenn du hier 15 % Überschreitung erlaubst, verschwindet die Warnmeldung: Ein zu hoher MPP-Strom führt im Betrieb nicht zur Abschaltung des Wechselrichters, es kommt aber zu Abregelungsverlusten, die du dir in der Energiebilanz ansehen kannst: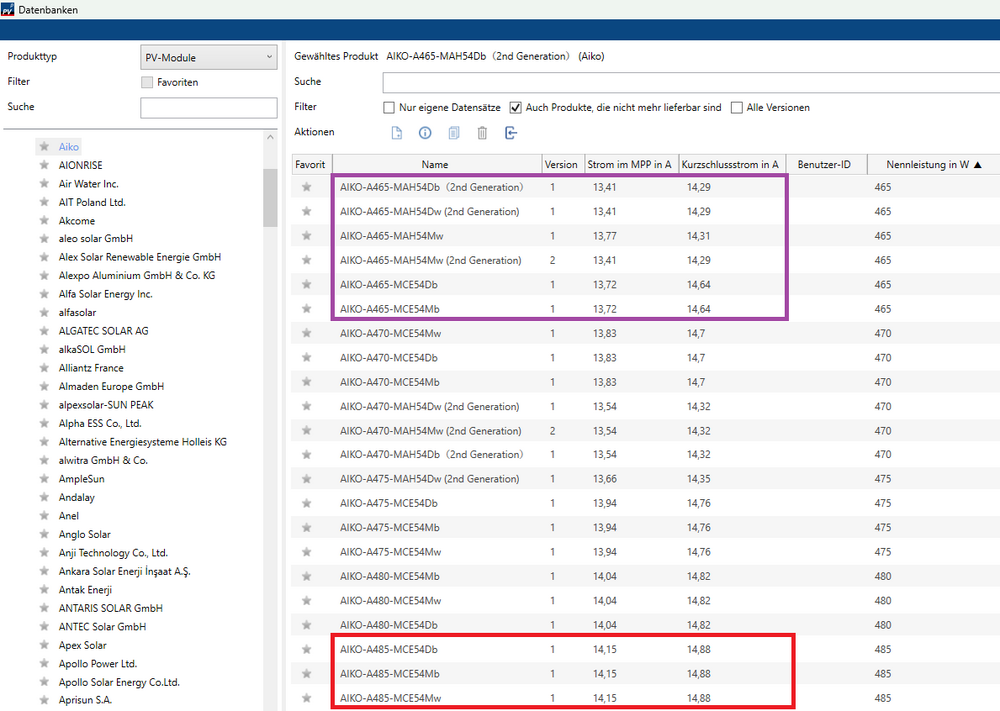
-
Einspeisevergütung pro Jahr und Betrag der jährlichen Netzeinspeisung
hotline_oh replied to Philipp IW's topic in PV*SOL
Hallo Philipp, vielen Dank für deine Anfrage. Die Einspeisevergütung in der Tabelle oder Grafik ändert sich in jedem Jahr, auch wenn du keine Degradation eingegeben hast, weil nicht der Betrag der Einspeisevergütung, sondern der Barwert angezeigt wird. Das heißt, die Einspeisevergütung jedes Jahres wird mit dem Kapitalzins (der Umlaufrendite) auf den Anfangszeitpunkt abgezinst. Falls du den Betrag der Einspeisevergütung unverzinst im zeitlichen Verlauf sehen willst, setzt du den Kapitalzins auf Null. Da die spezifische Einspeisevergütung (ct/kWh) auf Zehntel oder Hundertstel Cent genau eingegeben wird, geben wir auch die absolute Einspeisevergütung mit einer dritten Nachkommastelle aus.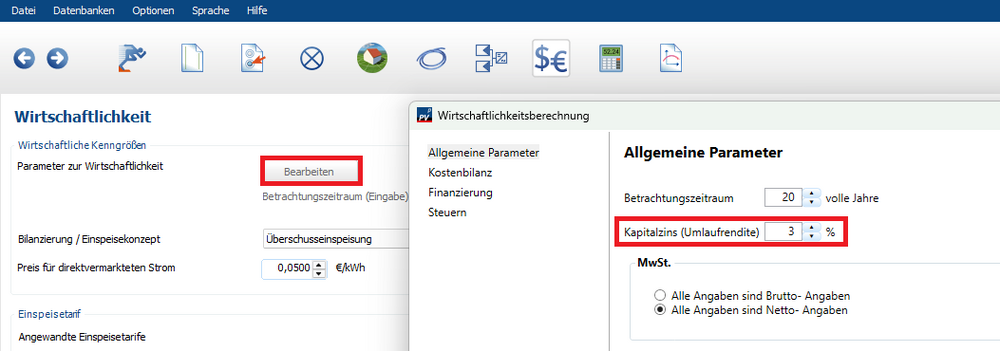
-
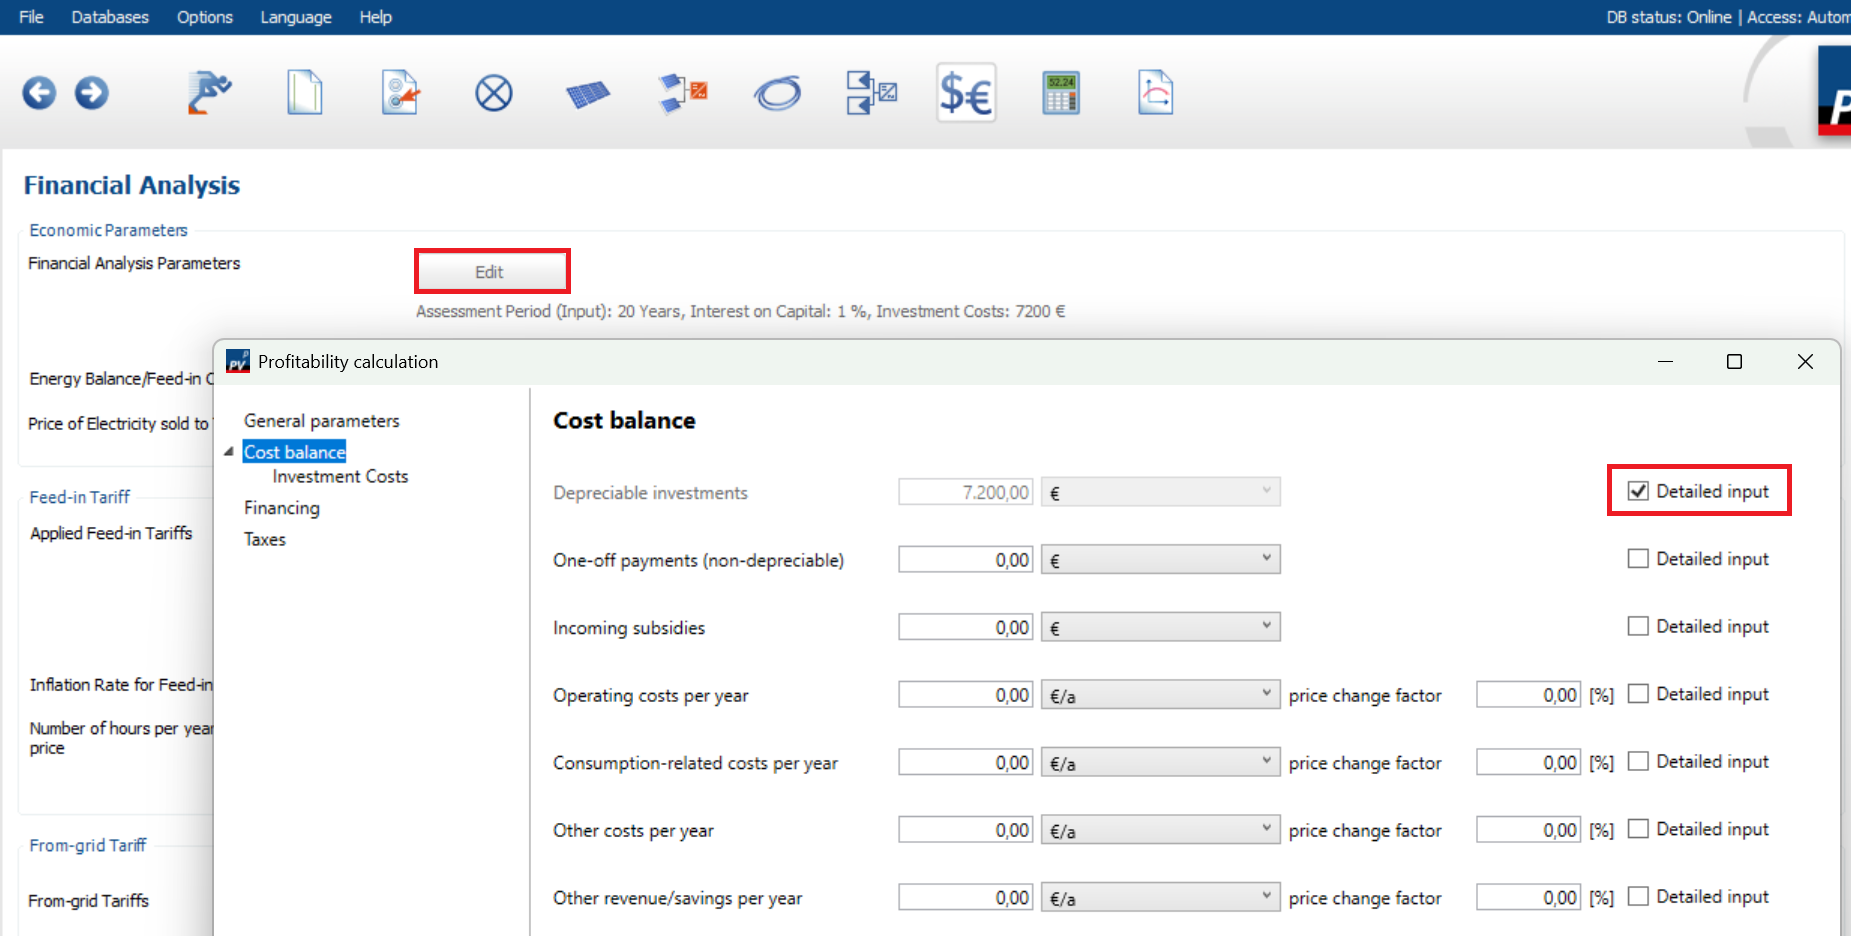
Hi Dave, Thank you for your inquiry. Our PV software cannot calculate costs. Component prices and other costs are not included. You must determine the costs of your planned system yourself. The calculated system price is entered into the profitability analysis and thus forms the basis for the financial forecast. The forms in the "financial analysis" module are pre-populated with sample values and do not represent average or empirical values. You must adjust these to suit your specific project. You can enter the detailed investment costs here:

-
When using 3D models, please note the following: File size should be as small as possible, with a maximum of 250 MB. The maximum number of vertices is 500,000 (we recommend a maximum of 200,000 vertices to ensure optimal performance). Textures should not exceed 4096 x 4096 pixels. No perforated or open structures in the silhouette of the 3D model. The higher the complexity of the 3D model, the poorer the performance of PV*SOL, even if, for example, the maximum number of modules has not yet been reached. The following file formats are supported: For models in *.obj format, a *.mtl file and a *.jpeg file must be located in the same folder. Visual material properties (e.g. reflection, transparency, specular highlights, etc.) are defined in a separate material file with the file extension *.mtl (Material Template Library), whilst texture data is stored in separate texture files (e.g. *.jpeg files). The size of the *.jpeg file must not exceed 4096 x 4096 px. If your 3D model is too large, reduce its size using 3D modelling software before importing it into PV*SOL. In MeshLab, for example, this can be done via Filters → Remeshing, Simplification and Reconstruction → Simplification.

-
For professional 3D modelling, we recommend the DJI Mavic 3E device. This drone is suitable for smaller and larger objects in normal lighting conditions. For large installations, we also recommend the Yuneec H600 with E45s camera. Smaller drones are only suitable for small objects and only in good lighting conditions and short shooting distances. The camera's CMOS image sensor should be at least 1' in size. The use of the flight pattern app Drone Harmony is recommended. A list of supported drones can be found here. Our partner solarklima e.K. offers expert training on handling the drone, creating 3D models and importing them into PV*SOL premium.
-
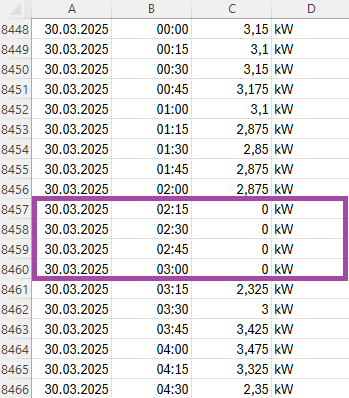
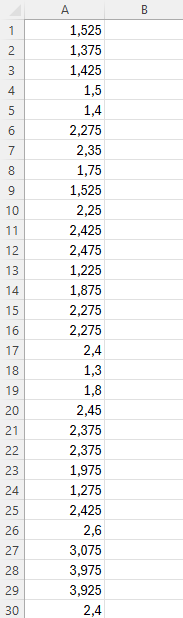
You need consumption data for a calendar year. With 15-minute intervals, you need exactly 35,040 values. "Four values too many" indicates that four zeros were added to the file due to the spring time change. Delete these four rows: Then delete columns A, B, and D. You only need the raw consumption values, without timestamps or column headers, in the first column of the Excel file: The error message "No read permission" appears if the load profile is still open in Excel. You must first close the Excel program (or the file) before you can import the file. Importing a load profile is also explained in our help documentation.
-
How do I incorporate a generation load profile into PV*SOL?
hotline_oh posted a question in FAQ (Read only)
You can simulate your project using a generation load profile (e.g., from a hydroelectric power plant or a wind turbine) with certain limitations. Note that the generation profile must be lower than the consumption at all times. If the hydroelectric power plant generates and feeds more electricity into the system than is consumed, simulation is not possible. The overall profile must not be negative. You can also subtract the hydroelectric power plant's profile from your load profile beforehand in Excel and set the negative values to zero. This could look like this: To import the load profile, you only need the actual consumption values (only the values in one column), without time data or column headers. Importing a load profile is also explained in our help documentation. Limitations of the results: The total electricity consumption is not the actual consumption, but rather the consumption difference. The amount of electricity generated by the hydroelectric power plant that is not used to cover consumption is not calculated.
-
If your climate data is available in hourly resolution (i.e., 8760 values each for temperature, global radiation, wind, and relative humidity), you can import it into our programs by saving it as an ASCII file, tab-separated, with the extension *.dat. The first lines (the file header) must look like this: Line 1: Location name "Vienna" Line 2: Latitude, longitude, altitude, time relative to Greenwich, -30 should remain. 48.11,-16.21,170,-1,-30 Decimal places for latitude and longitude must be entered in minutes, e.g., Vienna 48.1866° => input 48.11. For locations in eastern longitude, negative signs must be used when entering longitude and time. For latitude, a positive sign corresponds to the northern hemisphere. Line 3: Blank line Line 4: Must be copied as is; tab-separated Ta Gh FF RH Lines 5-8746: The following data lines are listed in the following order: outdoor temperature - global radiation on the horizontal plane/m² - wind speed - relative humidity; tab-separated. -5.0 0 1.8 75.5 -5.4 0 1.5 78.0 ... ... Please note that missing values must be filled with "0". Further information on importing your own climate data can be found in our help section.
-
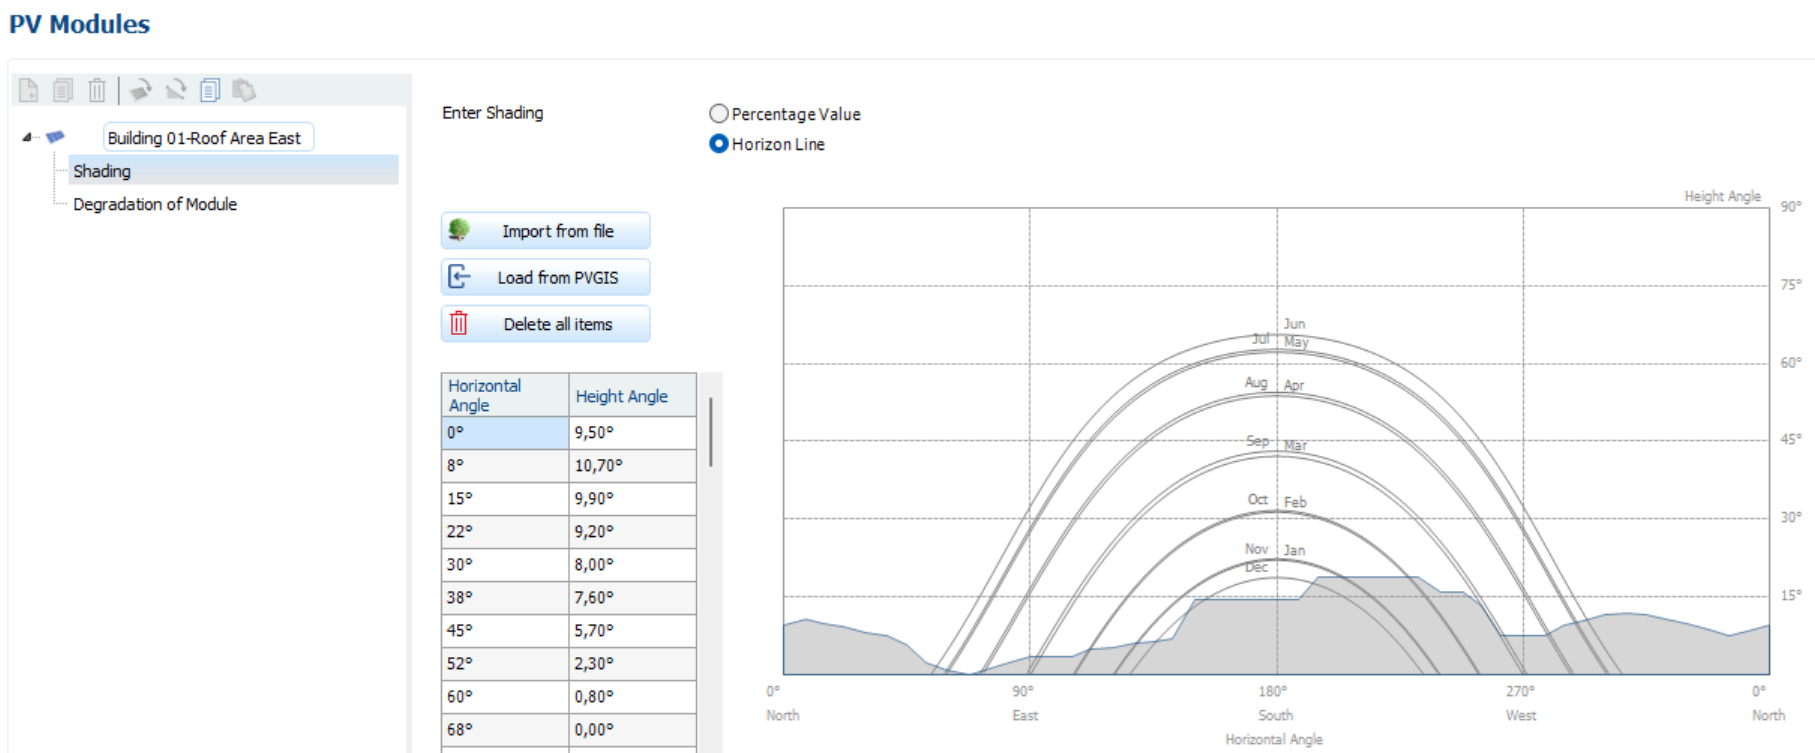
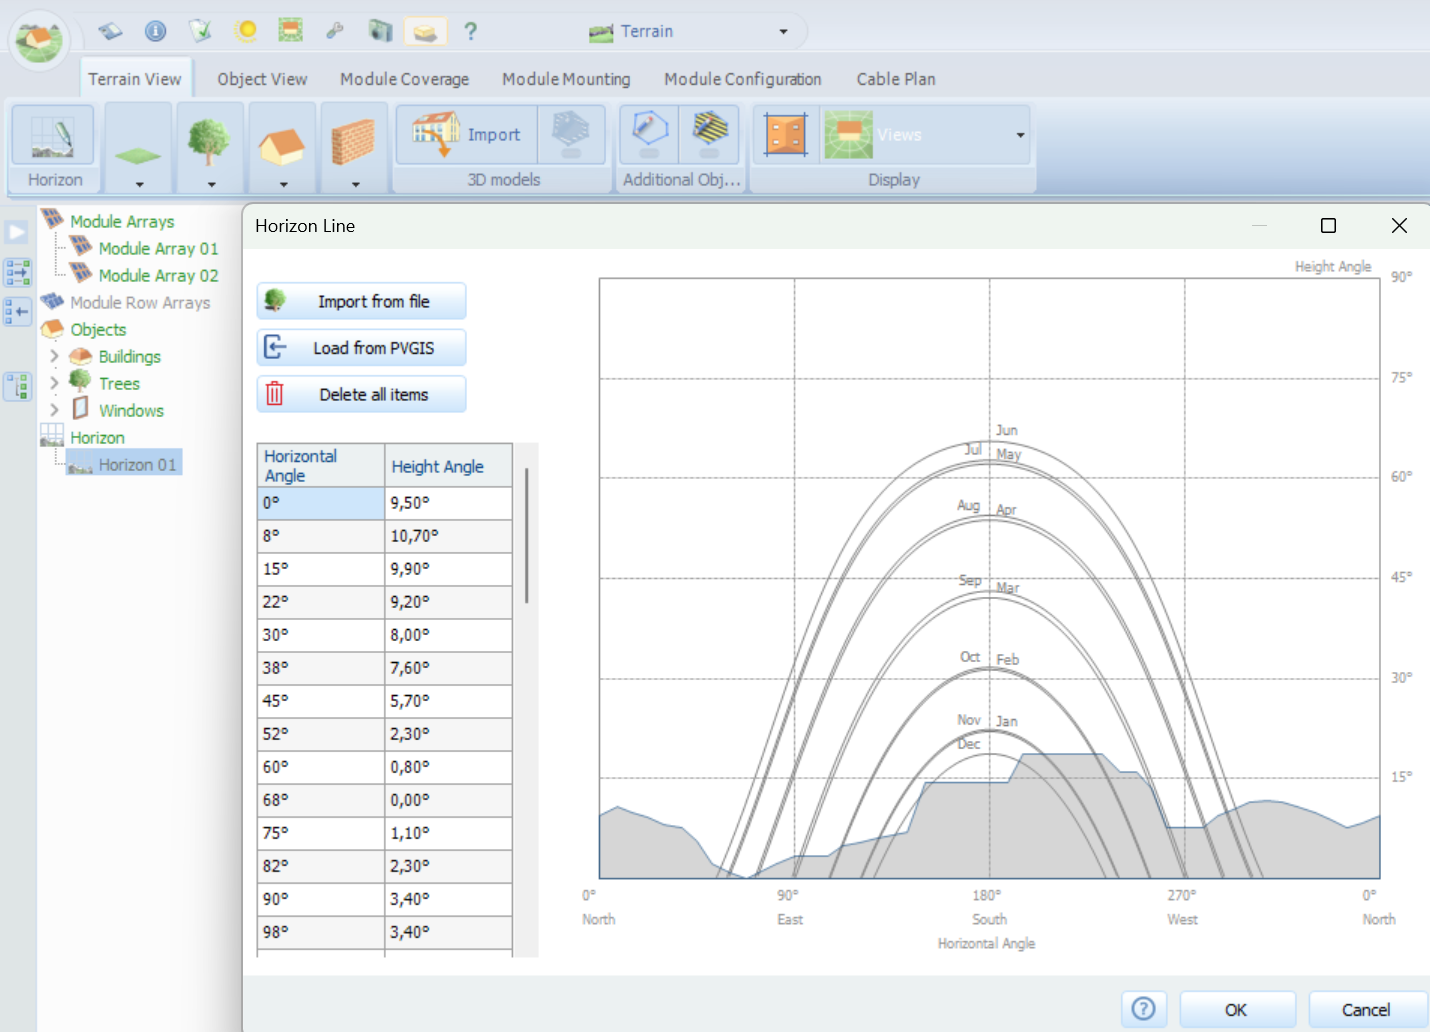
In the Shading/Horizon window, you can import horizon files using the import function. Our software is compatible with the HORIcatcher (Meteotest, Switzerland), Horizon (Energiebüro AG, Switzerland), and SunEye (Solmetric, USA) systems. In 2D planning: In 3D planning:


-
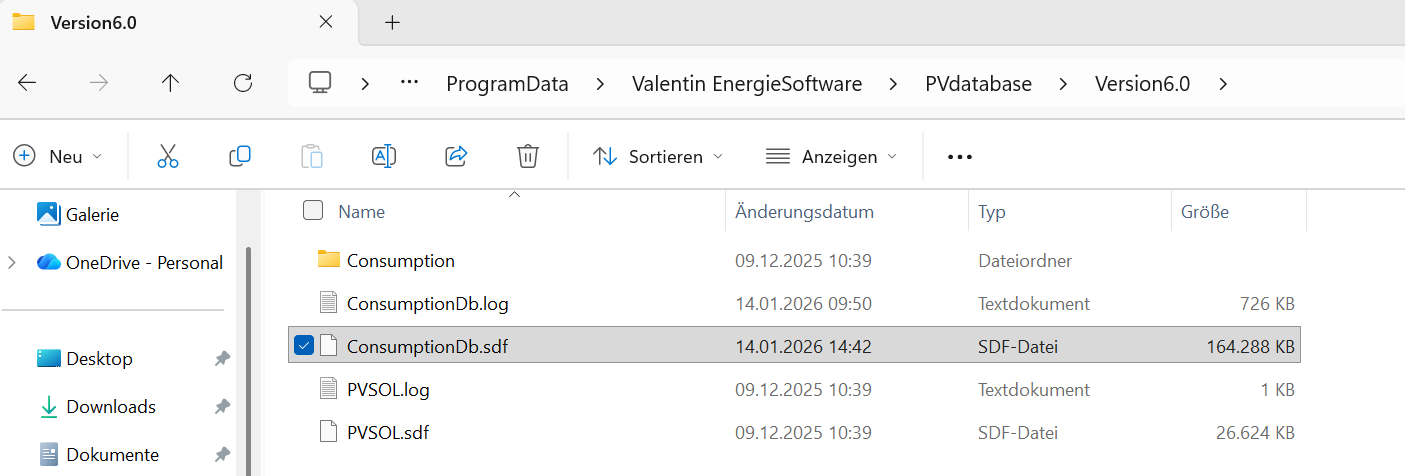
Your imported load profiles are saved in the file "ConsumptionDb.sdf", which you can find in the following folder: C:\ProgramData\Valentin EnergieSoftware\PVdatabase\Version6.0 To use the imported load profiles on another PC, transfer the "ConsumptionDb.sdf" file to the new PC.

-
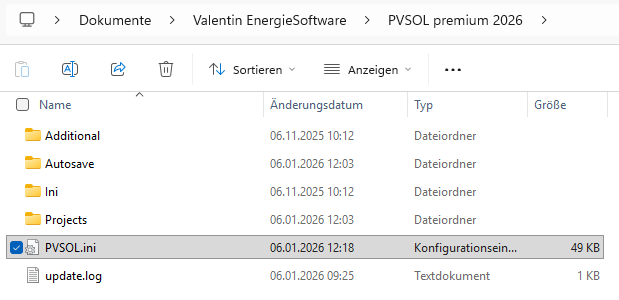
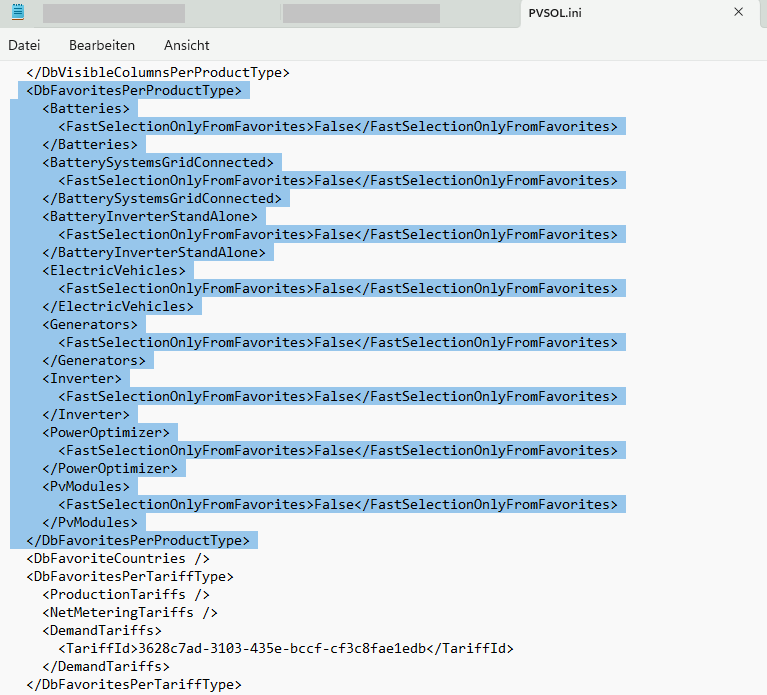
Your favorites are saved in the file "PVSOL.ini", which you can find in the following folder: Documents → Valentin Energy Software → PVSOL Premium 2026: If you want to access your favorites from another device, open the .ini files on both devices and copy the favorites from one file to the other.