


hotline_sf
-
Posts
202 -
Joined
-
Last visited
-
Days Won
13
Posts posted by hotline_sf
-
-
Hallo Deniz,
aus meiner Sicht müssten Sie die Anlage dann einmal ohne und einmal mit Speicher simulieren, ohne irgendwelche Kosten anzusetzen. Dann schauen Sie sich die Differenz des kumulierten Cashflows beider Simulationen an. Ist die Differenz größer als der Preis des Speichers, so lohnt es sich. Ist sie kleiner, dann nicht.
Sie könnten auch einfach die Anlage mit Speicher simulieren und den Preis des Speichers eingeben. Dann schauen Sie, ob Sie irgendwann ins Plus kommen. Das funktioniert aber eigentlich nur, wenn die PV-Anlage schon abgezahlt ist. Wenn nicht, muss ein Teil der Einnahmen ja auch zur "Tilgung" der Investition in die ursprüngliche PV-Anlage verwendet werden.
Viele Grüße
Sixten
-
 1
1
-
-
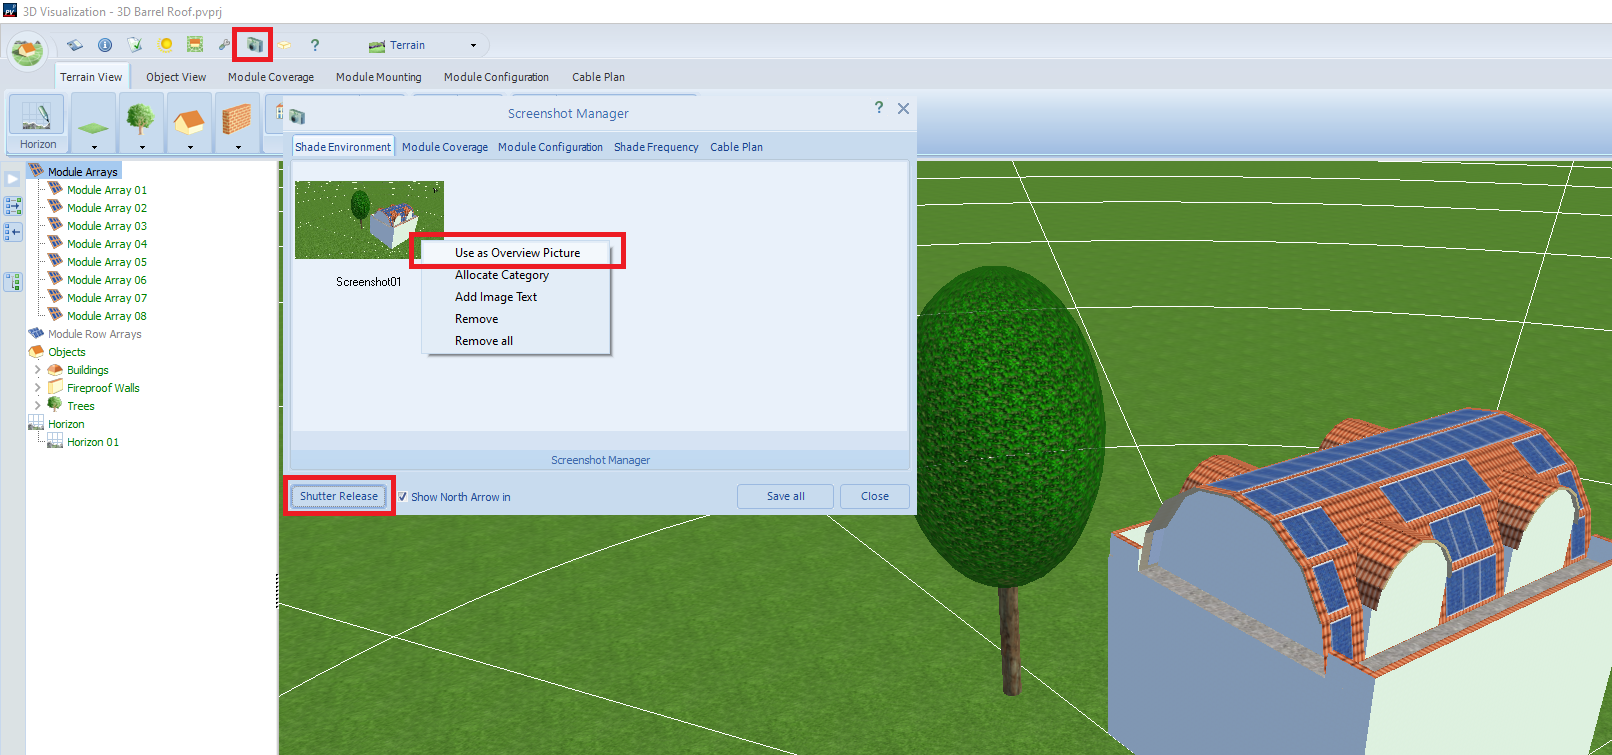
Dear Esteban,
If you want to use your own picture you have to make a screenshot of your wished view. For that you have to use the camera ico in the toolbar and afterwards press "Shutter Release". If you have the screenshot then please do a right mouse click on it and select "Use as overview picture". It then will appear in the report.
Best regards
Sixten

-
1
-
-
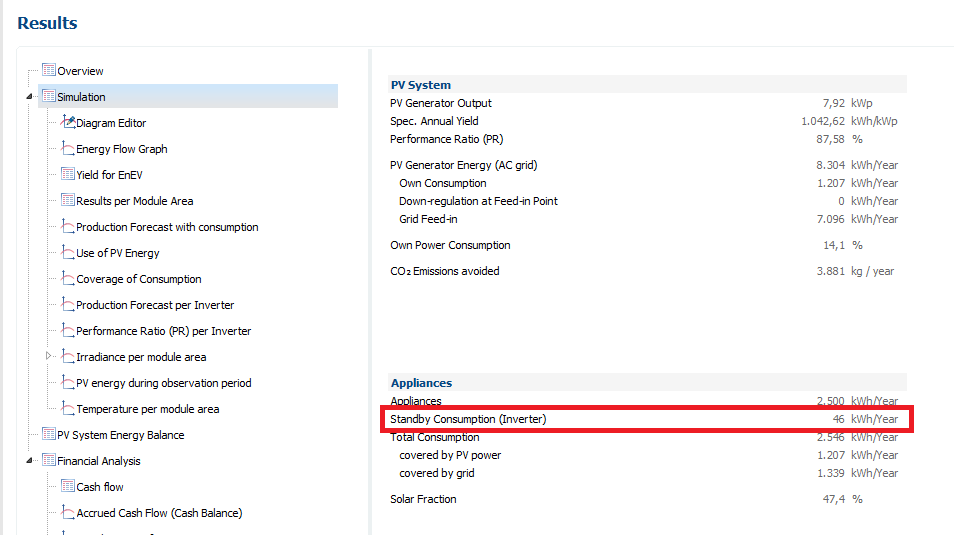
Dear Elisa,
If you have standby consumption of the inverter then you first have to substract that from the consumption covered by PV.
So the calculation is:
Electricity savings = [Total Consumption covered by PV power - Standby Consumption (Inverter)] * From-Grid Tariff Energy Price
Best regards
Sixten
-
1
-
-
Hallo Treichel,
bitte senden Sie die entsprechende Projektdatei mit der Frage an hotline@valentin-software.com. Dann können wir uns das mal ansehen.
Viele Grüße
Sixten
-
Dear Agata,
No, this is not possible. One license can only be used on one computer. For the options of buying a second license please contact our sales team under sales@valentin-software.com.
Best regards
Sixten
-
Dear Tomas,
Please send the project file to hotline@valentin-software.com. Then we can take a look at it.
Best regards
Sixten
-
1
-
-
Hallo Deniz,
das könnten Sie eigentlich nur machen indem Sie das Inbetriebnahmedatum der Anlage auf den Zeitpunkt setzen, an dem das Speichersystem dazu kommt. Bei den Investitionskosten müssten dann die verbleibenden Kosten der PV-Anlage und die Kosten des Speichers definiert werden. Der Betrachtungszeitraum müsste dann auch entsprechend verringert werden.
Viele Grüße
Sixten
-
1
-
-
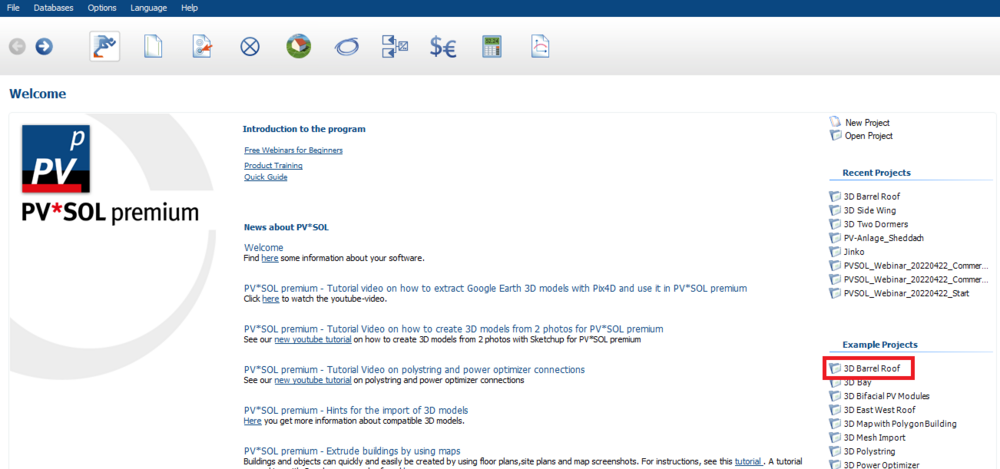
Dear mdeniz,
You have to define several attic storeys. They should have at least the size of a module if you want to place some on the roof area. You can find an example of this type of roof in the list of example projects. It's the project 3D barrel roof.
Best regards
Sixten
-
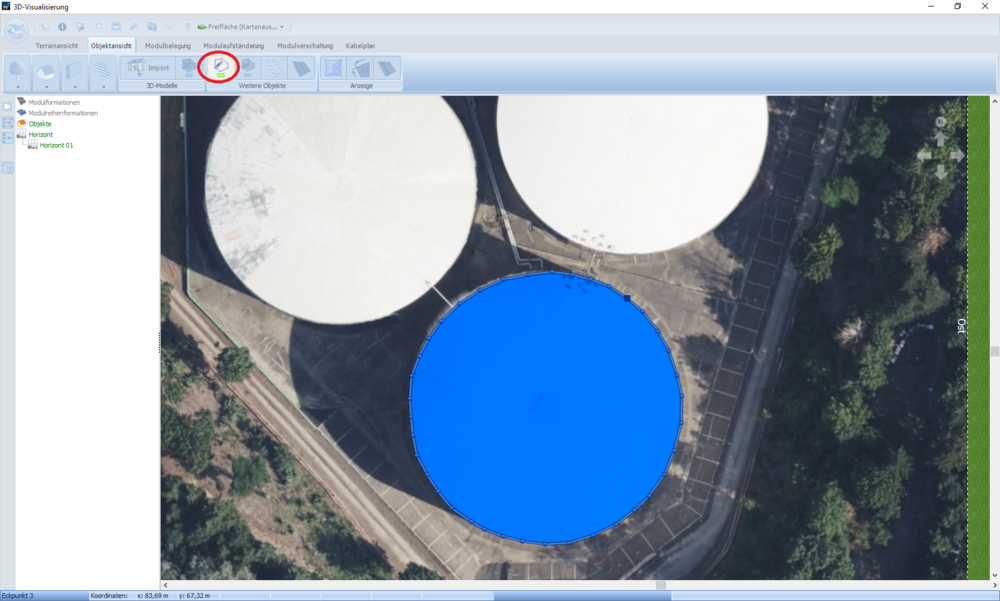
Dear mdeniz,
It is not to really possible to draw objects with a round shape. But you could use the polygon tool to draw an almost round polygon. Afterwards you can extrude the object by right clicking on the polygon and enter a height.
Best regards
Sixten
-
1
-
-
Hallo Wilhelm,
leider besteht nach wie vor nicht die Möglichkeit *.dwg-Datei zu importieren. Das funktioniert nach wie vor nur mit einer Bilddatei. Auch an den Grenzen hat sich nichts geändert und diese kann auch nicht umgangen werden.
Viele Grüße
Sixten
-
Hallo Alexander,
diese Meldung kommt normalerweise, wenn die Datei noch in einem anderen Programm geöffnet ist, während man versucht sie zu importieren.
Viele Grüße
Sixten
-
Dear Ales,
Unfortunately this is not possible. The building consists on two roof storeys which always are separated and cannot be merged. The only way to plan this would be to use a sattled roof and mark the corners with a barred area.
Best regards
Sixten
-
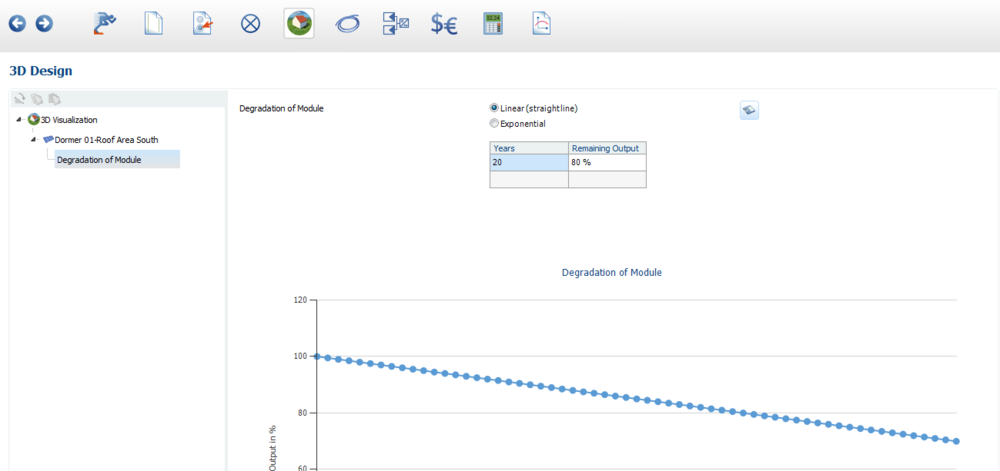
Hello Tom,
When using 3D then you will find the degradation option if you leave the 3D visualization after the planning. It's in the 3D design window (see screenshot).
Best regards
Sixten
-
Hallo Herr Kurz,
Sie könnten den Diagrammeditor auf der Seite "Ergebnisse" nutzen". Wählen Sie dort die gewünschte Netzeinspeisung als Größe aus und lassen Sie sich das komplette Jahr als Grafik anzeigen. Klicken Sie dann mit der rechten Maustaste in die Grafik und wählen Sie "Tabelle in Zwischenablage kopieren". Nun Können Sie das Ganze in Excel einfach einfügen.
Viele Grüße
Sixten
-
Hello Jakub,
1. I would like to ask how to understand the parameter "Price of Electricity sold to Third Party"? I noticed that it does not change "Revanue or Savings" regardless of the value entered.
This is only used if you have selected the Energy Balance/Feed-in concept “Surplus feed-in”. In this case if no feed-in tariff is selected or the feed-in tariff has expired because you have a longer assessment period than validity of the tariff then the “"Price of Electricity sold to Third Party" is considered.
This can be used if you don’t get any money for the energy you feed into the grid but you sell it to the power company or anybody else for a certain price.
If you have selected “net-Metering” then it’s not considered at all.
2. How is "Revanue or Savings" calculated?
In case of Net-Metering it is calculated:
Energy production – Cut-off
3. How to understand the parameter "Cutoff" in "Energy Supply Account"?
This applies if not all of the energy fed into the grid may be charged, but only part of it.
For example you produce 300 kWh solar energy in a month which you feed-in. But only 80 % of this can be charged. Then the cutoff is 20 % of the 300 kWh which is 60 kWh.
Best regards
Sixten
-
Dear James,
I was in contact with someone from Trina some weeks ago and they have entered some new products but the specified one was not amongst them.
Solis hasn't entered anything during the last to months. So, the 5G inverters are still not in the database.
I will contact both manufacturers and ask them to enter the new products.
The next database update is planned for beginnig of next week.
Best regards
Sixten
-
1
-
-
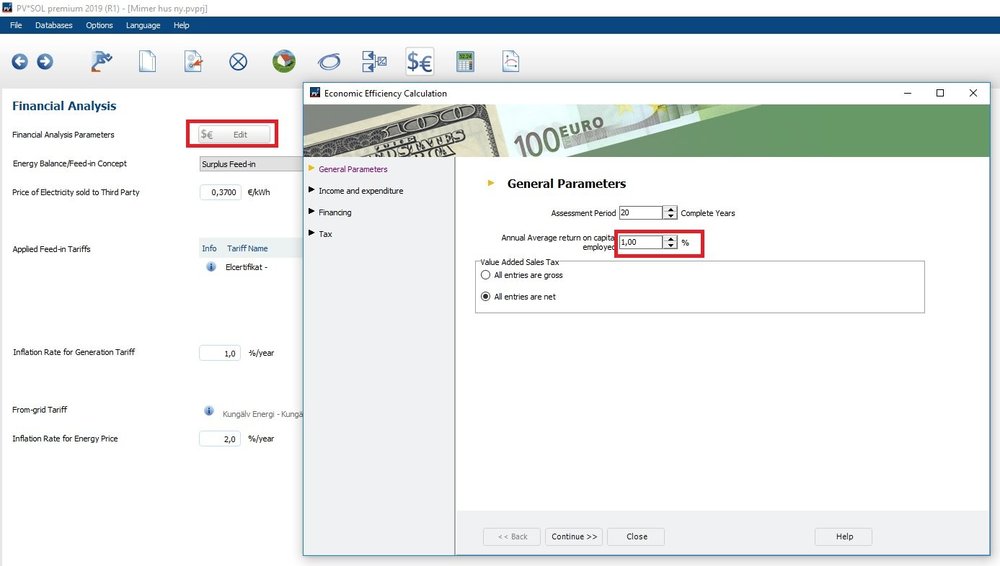
Hello Vishnu,
I guess it has to do with the annual average return on capital employed. Per default it is set to a value of 1 %. You can find it in the general parameters of the financial analysis. It represent the inflation of the money during the assessment period. So, every money value in the cash flow table is lowered by this percentage value per year, starting in the first year.
Best regards
Sixten
-
GeoT*SOL 2019 and PV*SOL/PV*SOL premium 2019 currently use different versions of the climate data tool MeteoSyn. If a climate data set is created in GeoT*SOL 2019, it is assigned an older version number. When PV*SOL is started, the climate data set created is then determined to be incorrect and deleted immediately, even though it is actually OK.
What can be done?
If you are using both GeoT*SOL 2019 and PV*SOL/PV*SOL premium 2019 on your PC, it is best to create new climate data sets in one of the PV*SOL programs. They will then be assigned the current version number and will not be deleted. Since all programs use the same directories for the self-created climate data, you can also find the newly created climate data set in GeoT*SOL 2019 and use it there.
We will solve the problem with the next update of GeoT*SOL 2019.
-
I have GeoT*SOL 2019 and PV*SOL or PV*SOL premium 2019. When I start PV*SOL, my climate data set created in GeoT*SOL is deleted and is then no longer available in GeoT*SOL. What can I do?
-
GeoT*SOL 2019 und PV*SOL/PV*SOL premium 2019 nutzen derzeit unterschiedliche Versionen des Klimadatentools MeteoSyn. Wird in GeoT*SOL 2019 ein Klimadatensatz erstellt, dann wird dieser mit einer älteren Versionsnummer versehen. Beim Starten von PV*SOL wird der erstellte Klimadatensatz dann als nicht korrekt ermittelt und sofort gelöscht, obwohl er eigentlich in Ordnung ist.
Was können Sie tun?
Wenn Sie sowohl GeoT*SOL 2019 als auch PV*SOL/PV*SOL premium 2019 auf Ihrem PC verwenden, so erstellen sie sich neue Klimadatensätze am besten in einem der PV*SOL-Programme. So werden diese mit der aktuellen Versionsnummer versehen und auch nicht mehr gelöscht. Da alle Programme für die selbsterstellten Klimadaten dieselben Verzeichnisse nutzen, finden Sie den neu erstellten Klimadatensatz anschließend auch im GeoT*SOL 2019 und können ihn dort nutzen.
Wir werden das Problem mit dem nächsten Update von GeoT*SOL 2019 beheben.
-
Ich habe GeoT*SOL 2019 und PV*SOL oder PV*SOL premium 2019. Beim Starten von PV*SOL wird mein in GeoT*SOL selbst erstellter Klimadatensatz gelöscht und steht dann in GeoT*SOL nicht mehr zur Verfügung. Was kann ich tun?
-
Hello Tim,
You are right the value should be 39 A. It was okay for the Home 10 but the Home 8 was wrong. I have changed it. With the next database update it will be corrected.
Best regards
Sixten
-
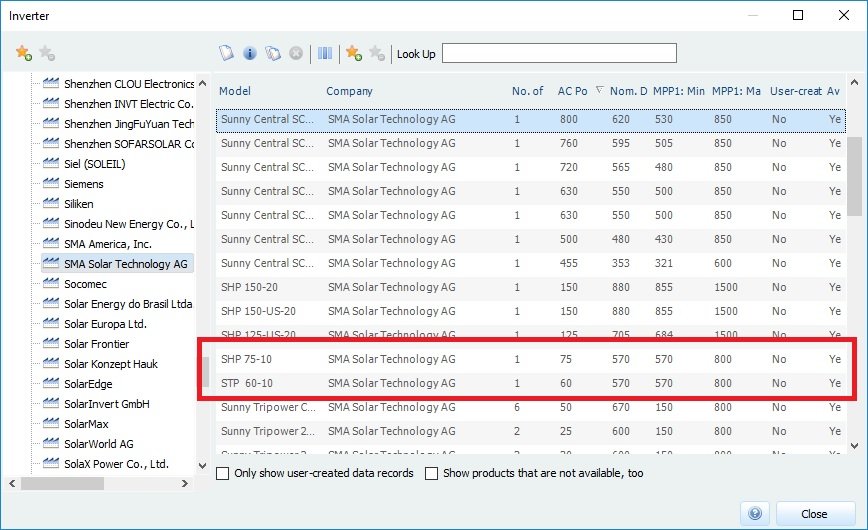
Dear M.Khalifa,
I have never heared of a SMA Tripower 75 inverter. There is also no information to it on the SMA website or else. Do you mean the Highpower 75 inverter?
Both, the STP 60 and the SHP 75 are allready included in the database of the latest program versions (see screenshot).
Best regards
Sixten
-
Dear Belal,
which value in the results exactly do you mean with the generated power of the collectors? If you mean the "Energy delivered by collectors" then it can be different even if you have the same number of the collectors because the delivered energy depend on the energy demand of your pool. If the demand is higher then the collectors have to or can deliver more energy.
The energy demand of the swimming pool depend on the defined parameters, e.g water temperature..., and the different losses:
- evaporation losses
- convection losses
- transmission losses
- radiation losses
Then of cource you gain some energy due to the irradiation from the sun.
Best regards
Sixten


Ökobilanz (Eco balance sheet)
in PV*SOL
Posted
Hallo,
das findet man auf der Seite "Ergebnisse" unter dem Punkt "Simulation". Dort stehen die vermiedenen CO2-Emissionen.
Viele Grüße
Sixten