Ricardo
-
Posts
27 -
Joined
-
Last visited
-
Days Won
2
Everything posted by Ricardo
-
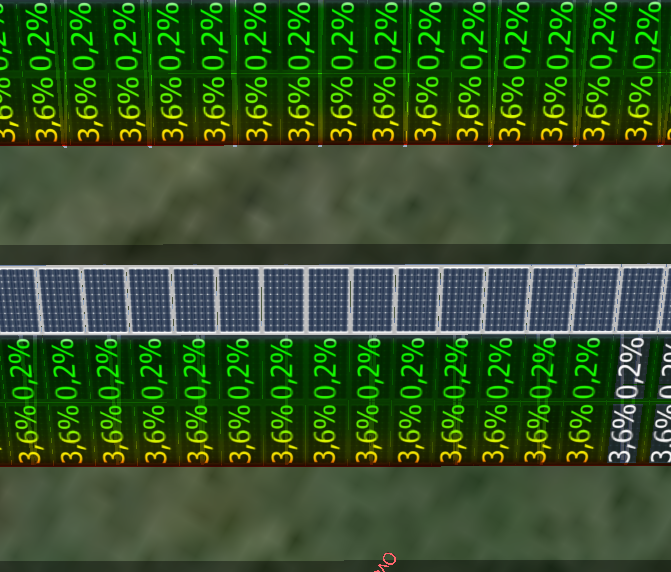
Dear PV SOL users & team, I noticed that PV SOL reports show a figure for shading losses, can somebody please explain exactly what it means? In a project I am currently working on, this figure is 7,0%/year. However, the highest shading % displayed by a single module is 3,6% and of course, many modules show lower values, so it is obviously not an average as I initially thought. Can somebody please explain what each figure (on individual modules and in the report) means and how they correlate? I would imagine that the figure on the module means the energy loss due to shading on it and likewise, the figure on the report is the overall energy loss due to shading, which can be higher than in any of the modules because of "shading mismatch" (that is, in an extreme case when one module is shaded 50% of the time and another module is shaded the other 50% of the time, the whole string is lost, so losses would be 100%). I would really appreciate if somebody could confirm this or if not, explain how it works. Thanks in advance for your help!
-
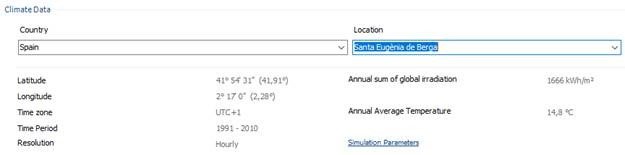
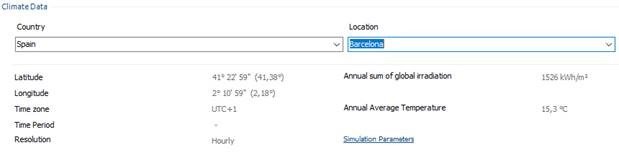
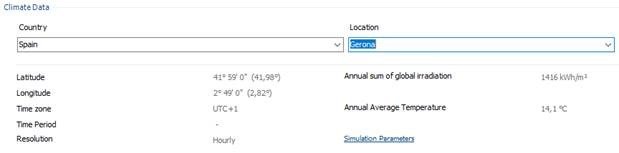
Dear PV SOL users & team, I have been using PV SOL Premium 2018 for some months now and a question arose on climate data sensitivity. I am designing a project located in north-east Spain, more specifically in the area marked in yellow in the screenshot below (in a town called Santa Eugenia de Berga, Spanish ZIP code 08507), but the closest climate data as is would be from either Barcelona or Gerona, marked in red below: I understand PV SOL is able to interpolate data via the “Create climate data for new location” in this screen, but could you please clarify which data points are used for that calculation? When I create the new location “Santa Eugenia de Berga” I notice that irradiation is higher than that of either Barcelona or Gerona, which leads me to think there are more points involved in this calculation. Could you please let me know which points would be taken into account for this simulation? And la st but not least, I understand PV SOL interpolates data but doesn’t take into account local conditions, right? In this specific area I’m looking at there is a lot of fog, but I imagine this is not considered. Could you please confirm this as well? Thank you very much for your support.