Peter_
-
Posts
21 -
Joined
-
Last visited
-
Days Won
2
Everything posted by Peter_
-
hi, often PVsyst is still used for bankability of large pv systems but if you ask me, two things where PvSol stands out are: - graphs and analysis, the insight gained by being able to create your own energy diagrams/graphs in Pvsol is much more easy to use and much better. - newest weather data, Meteonorm 8.2 is used in pvsol whilest pvsyst uses 8.1, pvgis 5,2 , or nasa hope it helps,
-
Thank you Frederik!
-
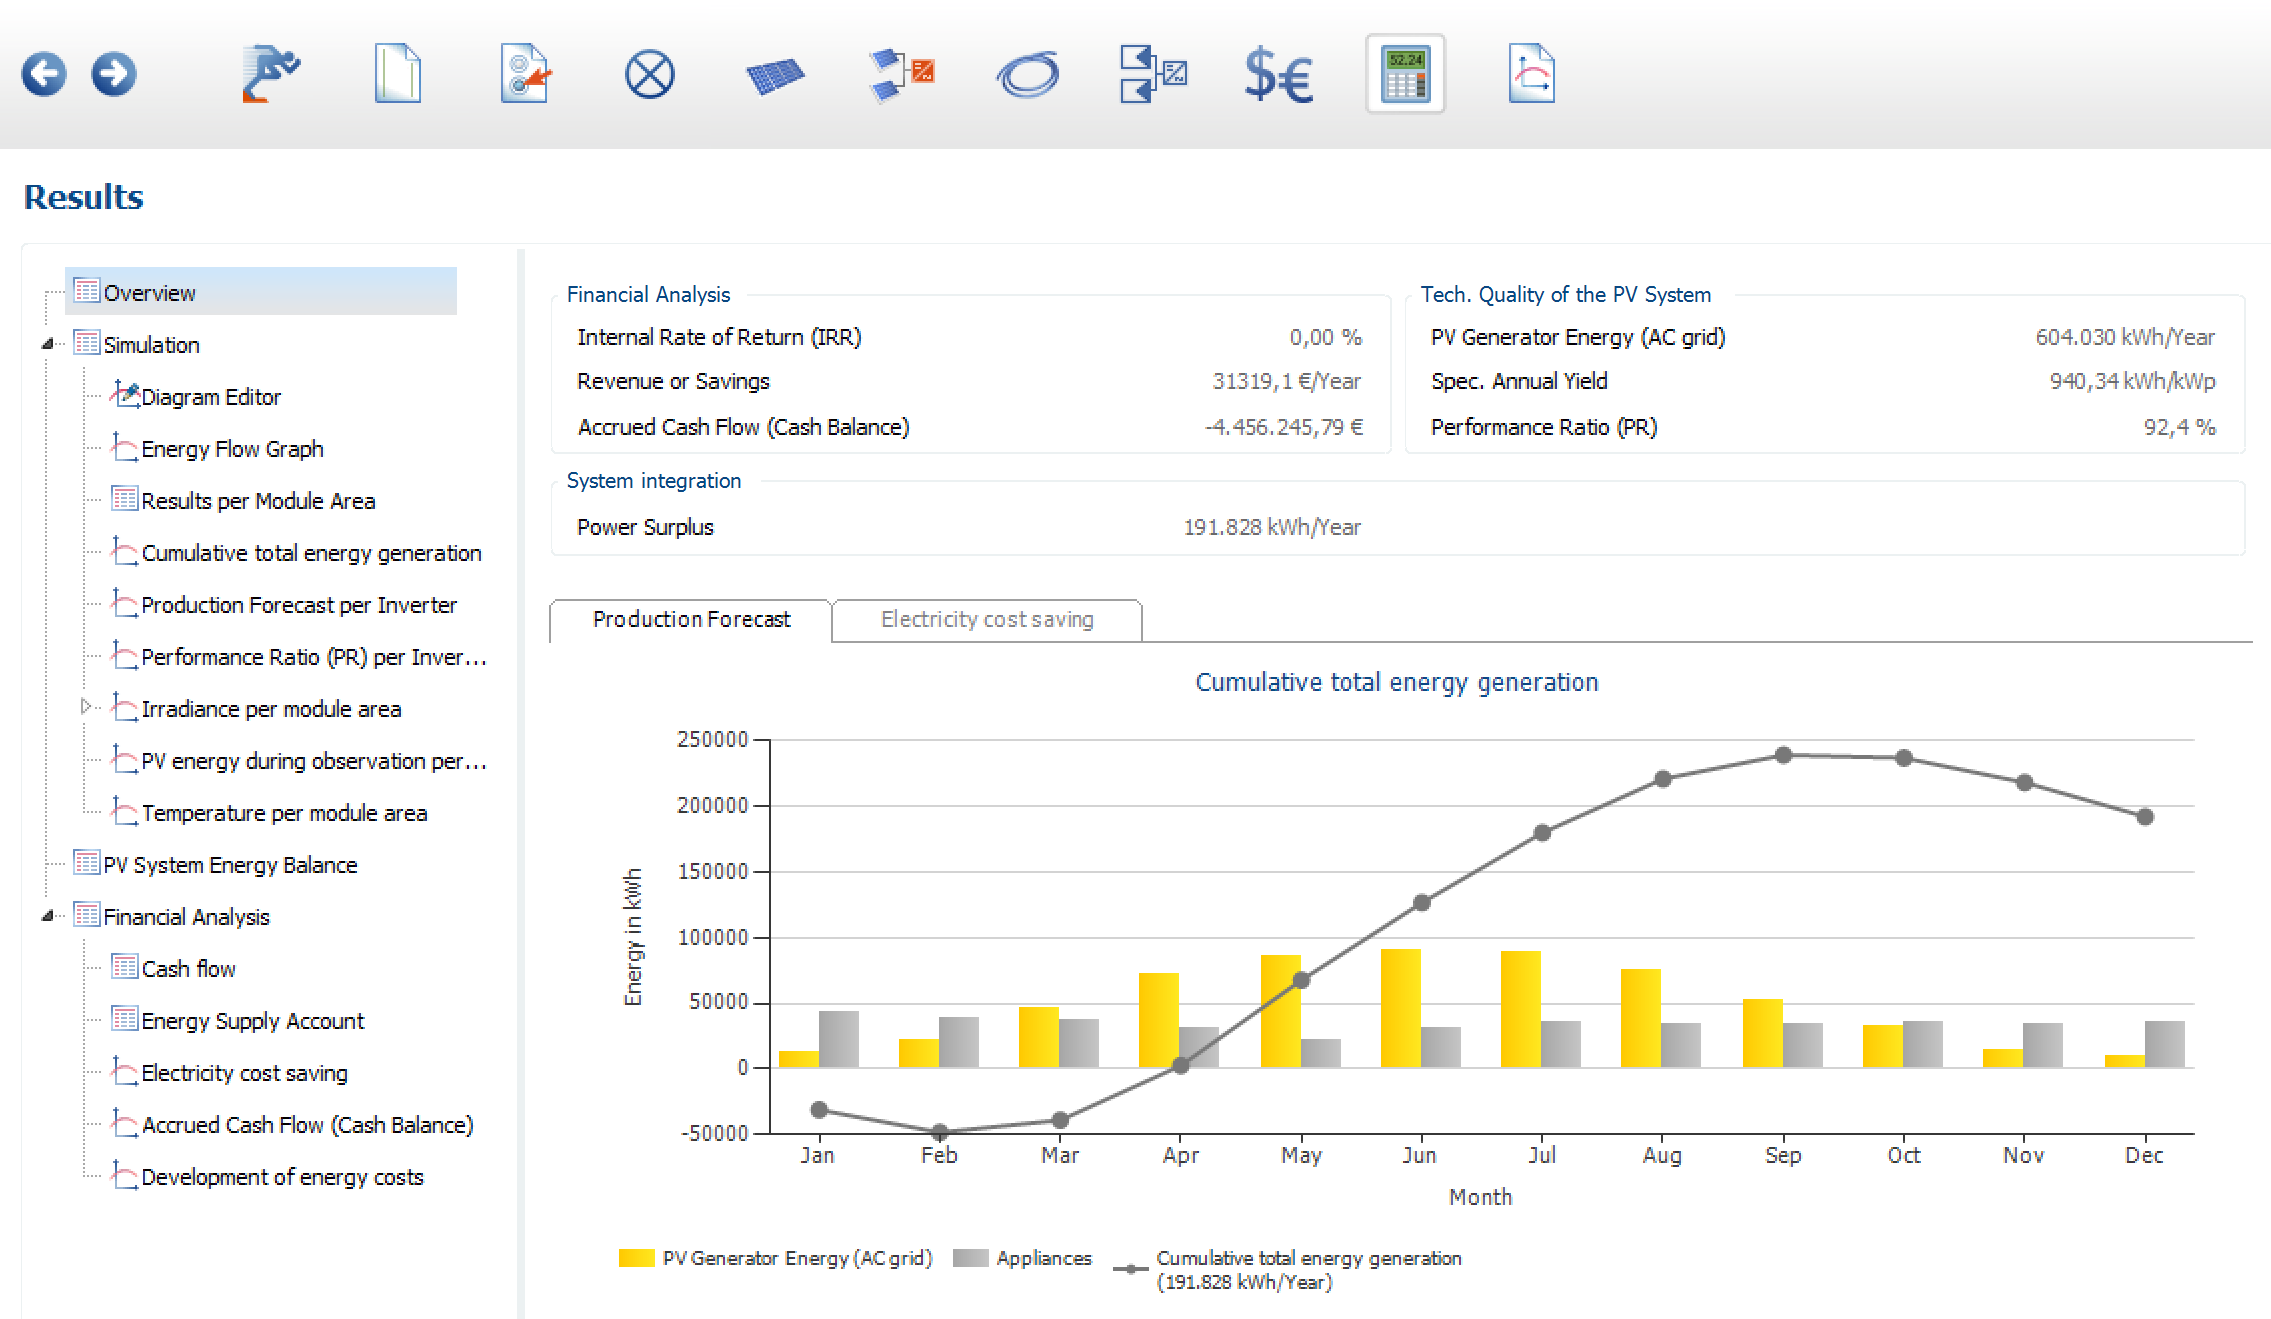
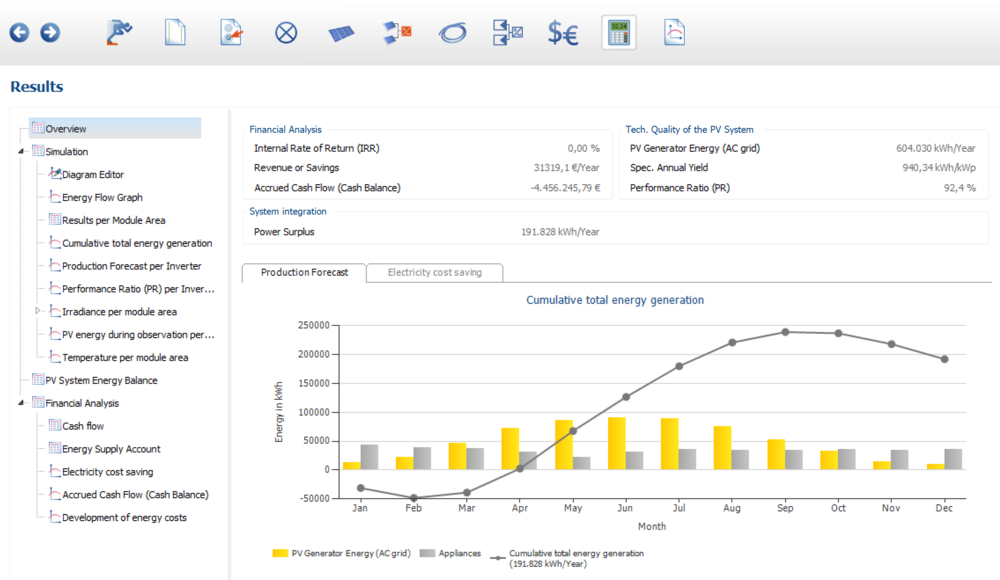
Hi, For a project I need to calculate the monthly PR values, what would be the best way to do this? I noticed the result page has performance ratio per inverter, how to I calculate the 'project' total PR from this. Should I average the values for every month? or maybe weighted average (sum of (WPx inverter pr) divided by total WP) or should i dive deeper and just use the PR formula to calculate the monthly Pr values thanks in advance Peter
-
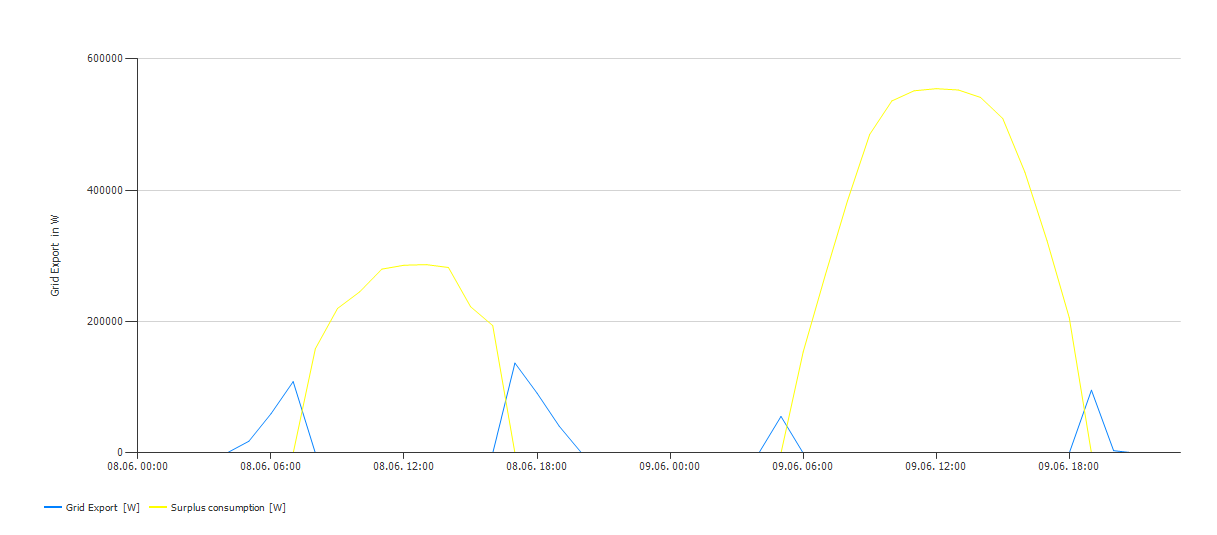
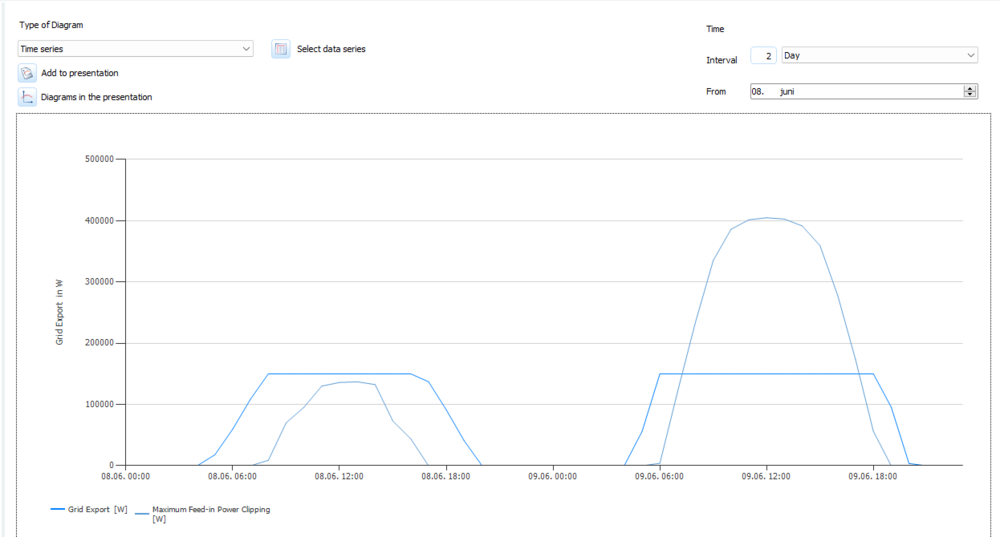
hi, solved! 1) the first condition was 150KW is to be fed into the grid 2)the second condition: any leftover energy (>150kW) becomes available for neighbors and i want to calculate this on an hourly basis. i solved it by first calculating without any grid limitation., then calculate it with 150KW grid limitation. and substract those values to get the difference. it gets close enough approximation to solve it for now thanks anyway Peter
-
Hi, We have a project whereby we want to calculate the surplus energy. I would like to have the hourly profile - the grid export can be 150KW. we want to investigate how much energy is surplus and maybe could be used by nearby neighbouring users. what would be the best way to model this case? 1) at first I modelled the system and put the export limitation at 150KW ,and add grid limitation inverter level -> grid export is the exported energy whereas Clipping on account of the max. AC Power/cos phi then would be the excess energy 2) include consumption in the model, add a surplus consumption consumer. this seems to give me the inverse of the results I want. as soon as the maximum power is reached the excess energy goes to the grid. dynamic consumer also does not exactly do what I want. because as soon the export reached 150KW all energy goes to surplus consumption, including the first 150KW . option 3 would be add a yearly consumption of 1kwh. and add grid limitation at feed in. this would give me i think what i want. I hope its a bit clear what I try to achieve. do you perhaps have a solution. or is the only way to make a workaround in excel results thanks in advance


-
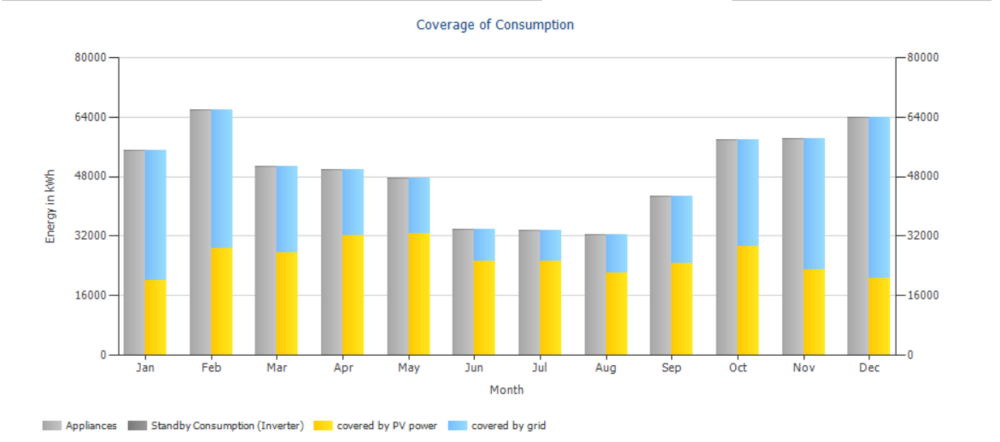
hi, Just a small request: when copying tables from pvsol to excel it gives the table units W, this should be KWh. my internal me can't cope with wrong units so i always have to manually edit it Appliances Standby Consumption (Inverter) covered by PV power covered by grid Month W W W W <--------- here Jan 54971,7 104,3 20176,6 34899,3 Feb 65860 85,1 28684,2 37260,8 Mar 50555 81 27640,1 22995,9
-
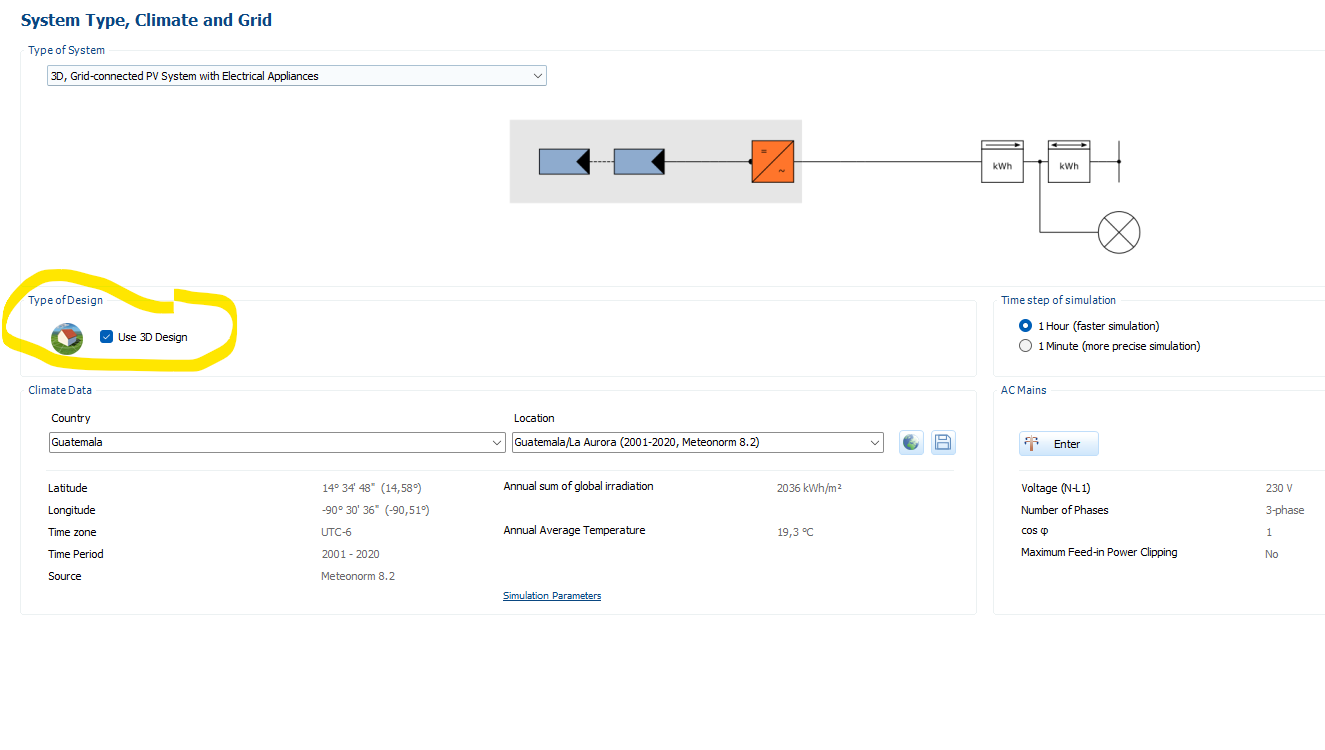
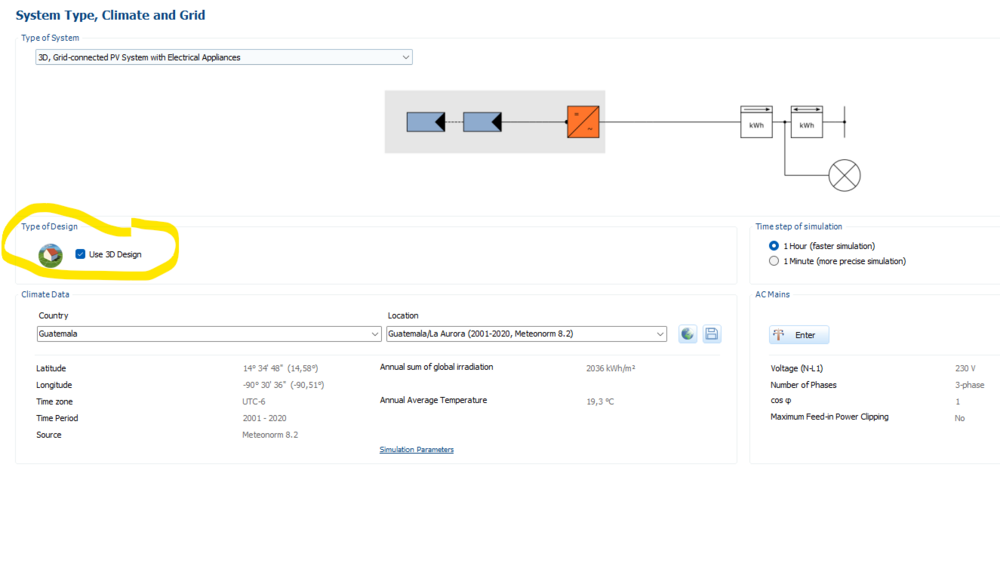
Hi E-pn you don't have to restart the program, it is possible to toggle 2d/3d under system type, climate and grid. It will delete your 2d design (because it asks yout to define the 3D design) however your climate data settings and such will be kept. I would recommend to make an extra backup before switching. Hope it helps, Best wishes,
-
edited above text
-
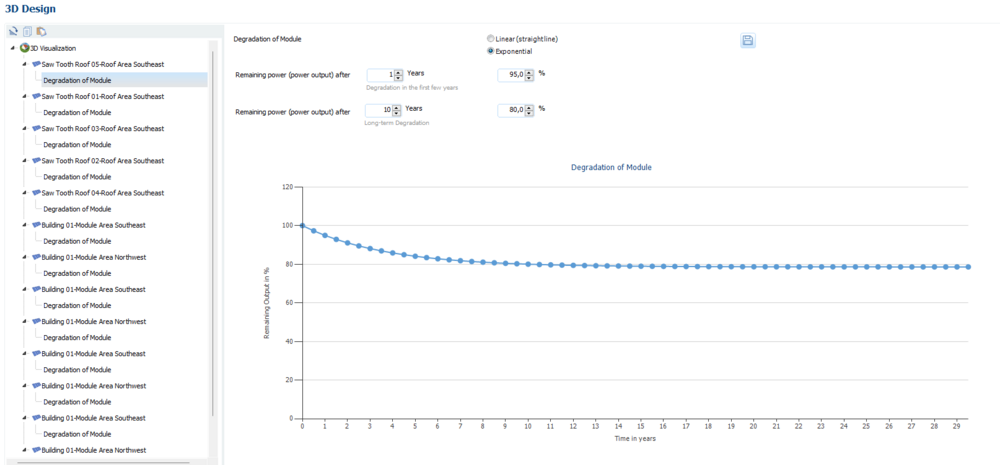
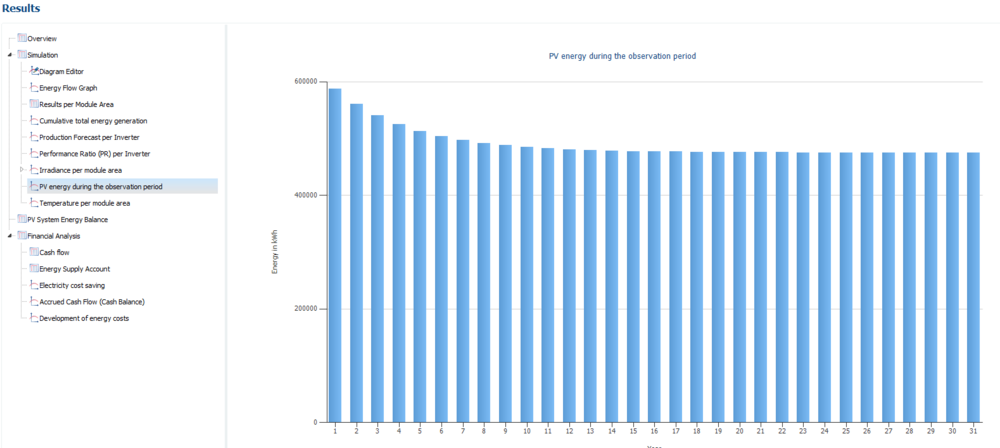
Hi Hom, Yes, that is possible with PvSol. ah check @developer_fw . I showed the 'extrapolate the yield reduction to wider time span' version I see. While still using one typical meteorological year as basis of the simulation The module degradation profile you can adjust at the (3D) design tab then the project lifetime can be adjusted under finance, -> edit Finally after simulating you can find the 30 year production under the tab: results -> PV energy during the observation period. Hope this answer helps, if you have any more questions please ask, happy to help you Peter


-
Variable grid export limitations. with grid capacity congestion becoming a growing problem, we need to get more and more creative to be able to get a grid connection . One of the solutions being under investigation is variable grid feed in. based on: day and night week and weekend seasonality I know its a bit of a niche, but the ability to model the time at which we are allowed to have grid feed in (or not) would be nice to have. (For the moment we can use the excel results to model it. )
-
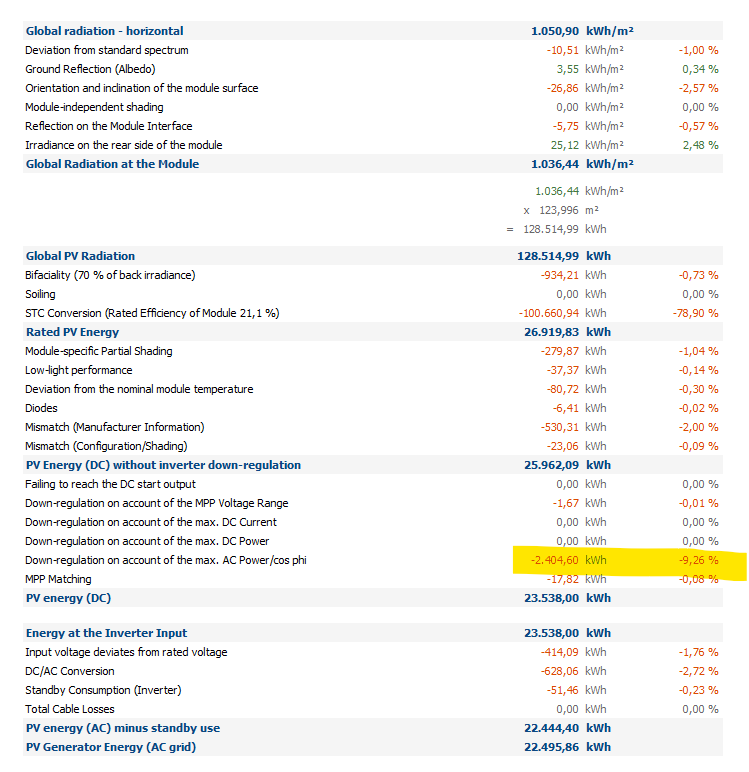
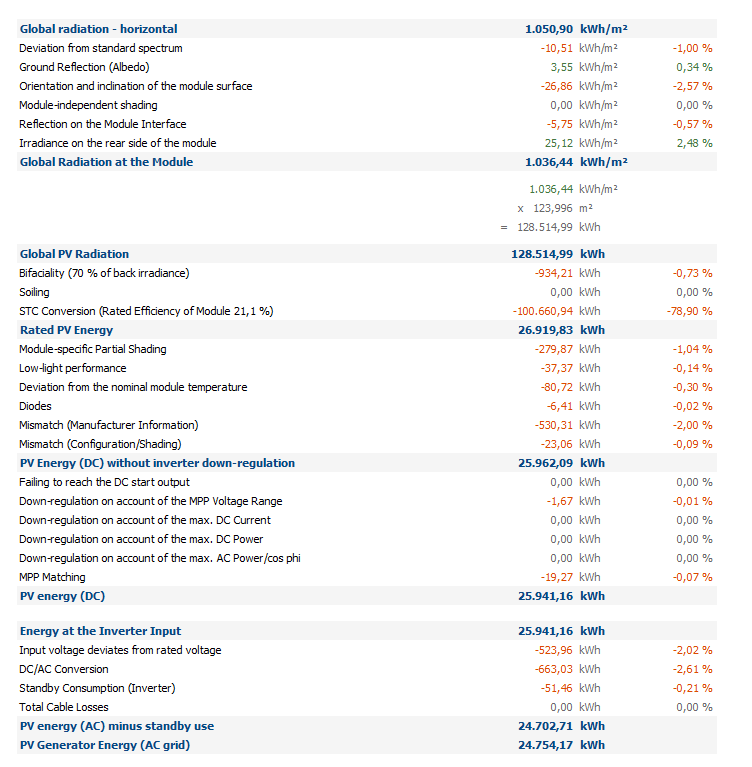
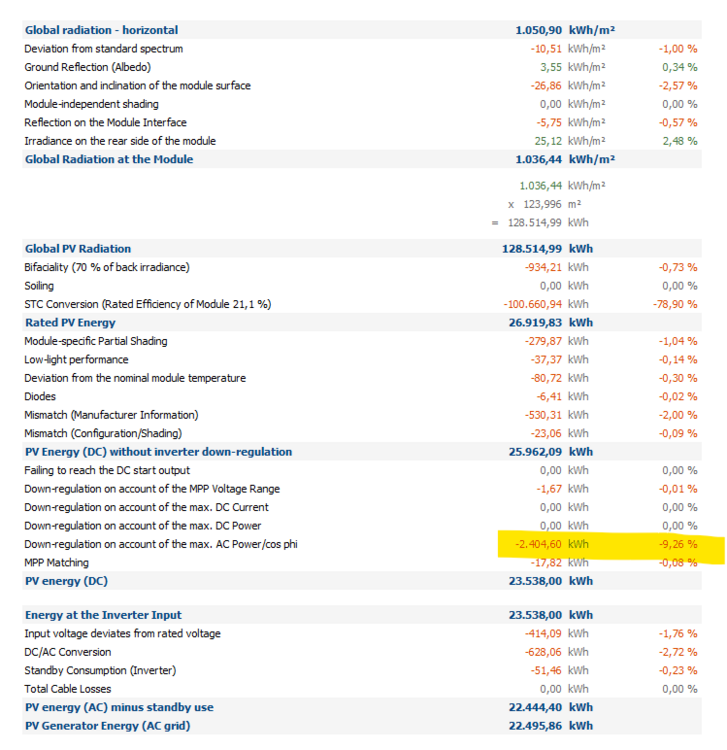
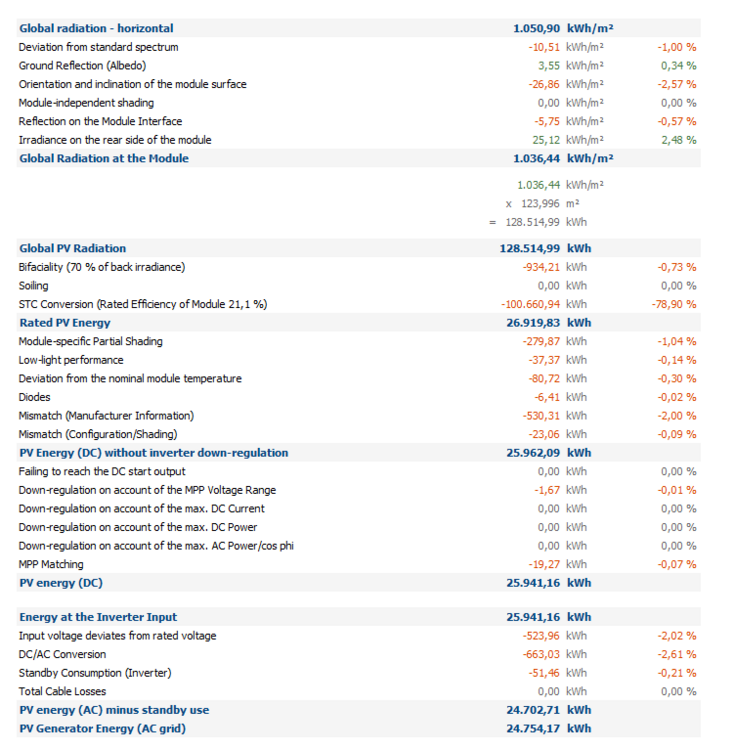
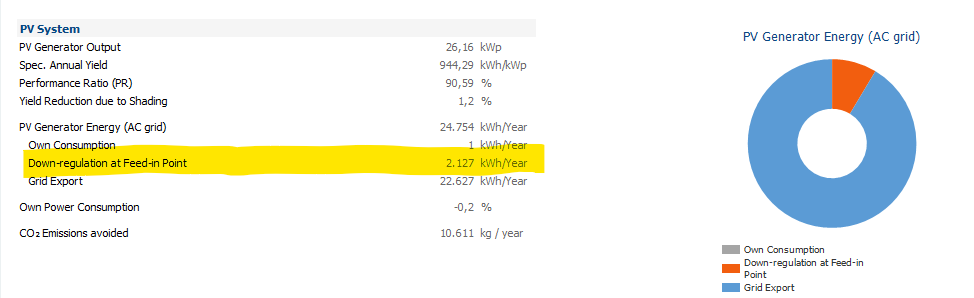
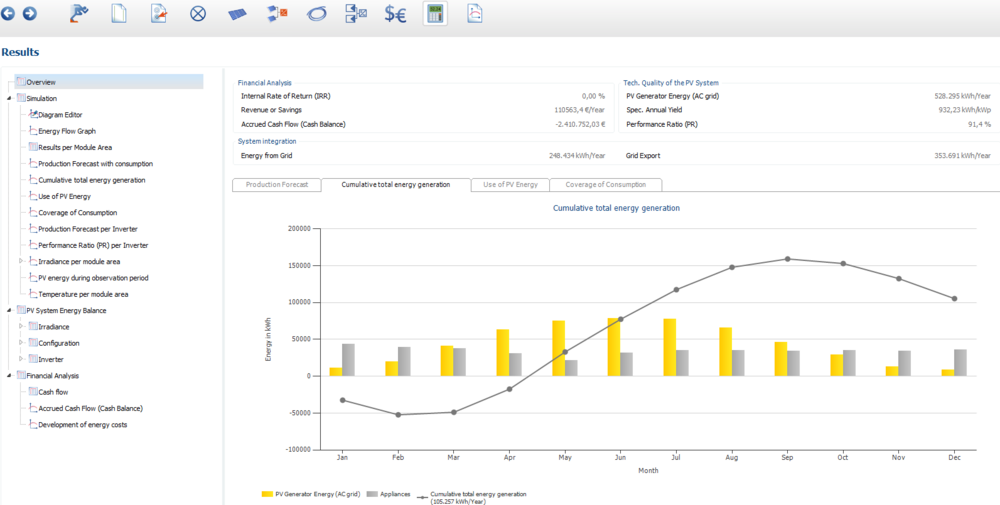
Hi Ricardo, regarding question 1: In order to make the "at feedin" option box clickable you need to add an own-consumption. you can change the type of system to as follows: change the type of system to gridconnected with electrical appliances. if you dont have any own consumption then I would suggest adding a yearly consumption of 1kwh as this is neglectable The main differences between the two options is,as the name says, where the feed-in power clipping is done. in the first option you will clip at the inverter, 550 kW nominal AC power is always clipped at the inverter to 440kw. However if you have an own consumption, you dont want to reduce the power of the pv system at the inverter because you can use its electricity yourself. hence you want to clip at the feed in. in that case after own consumption you check at the grid connection if the power is 440kw and if it is more it will do the feedin power clipping. ** note: in practical situation the grid feed in meter sends a value to the controller and the controller active-dynamically adjusts the inverter output ** if you dont have own consumption you can check either options however be aware of the following: if you check inverter clipping it shows it in PV system energy balance as down regulation on account of the max ac power/cos phi. however if you use grid feed in checkbox. It does not show in the energy balance because the clipping is done at feed in (which isnot in the scope of the pv system energy balance) in that case look at the simulation results where it shows: hope it helps!

-
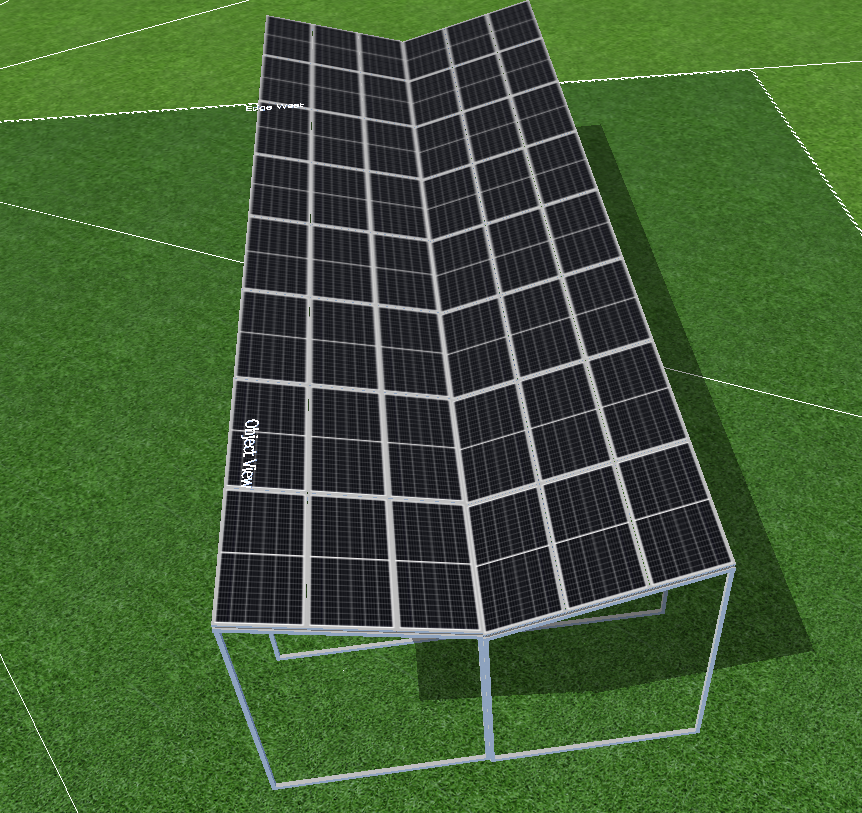
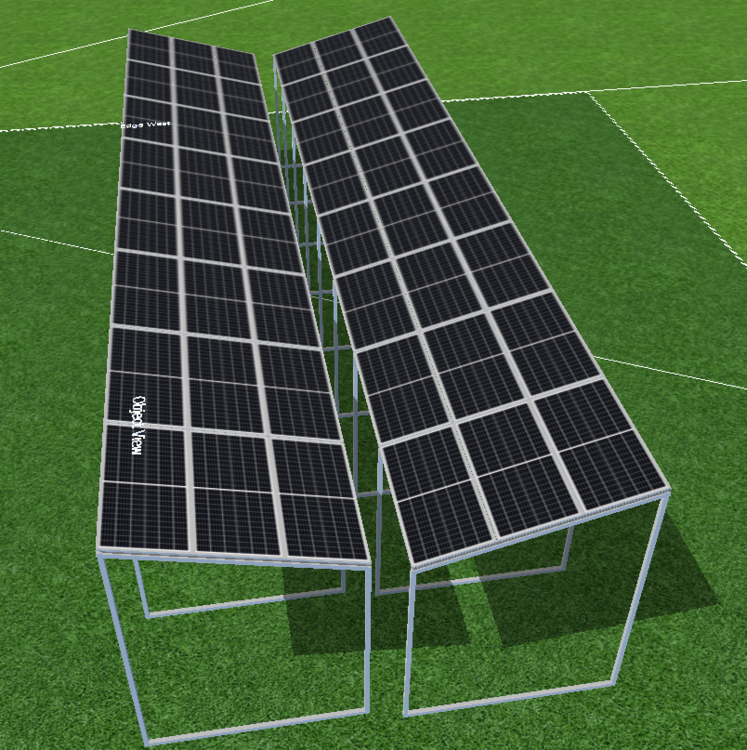
not sure what you ment there @Pumperniggl, I made seperate rows one facing east, one facing west, and i can drag and drop them 'against' eachother. collision is on and thus no spacing in between at the design. it will ask for "connect to array" with a followup this is not possible due to different orientations. But nevertheless in general: interesting to use the module mounting to design carports. I always made a solid building and used the module coverage option. But this way is much more elegant and visually better looking. Great idea @Jimmy !! @devs, i would not mind this kind of T-shaped module mounting to be added to pvsol in addition of the tilt/EW and facade option. It is a very common design for carports.

-

Climate data and Configuration data lost during upgrades
Peter_ replied to Marius Fourie's topic in PV*SOL
Personally I noticed too the standard weather location goes to Berlin/germany with every update, however i never recall loosing weather data (and/or module data). offtopic: I also noticed with 1 day remaining on a trial version that with a pvsol version update it resets back to 30 days! Its not a bug, its a feature! -
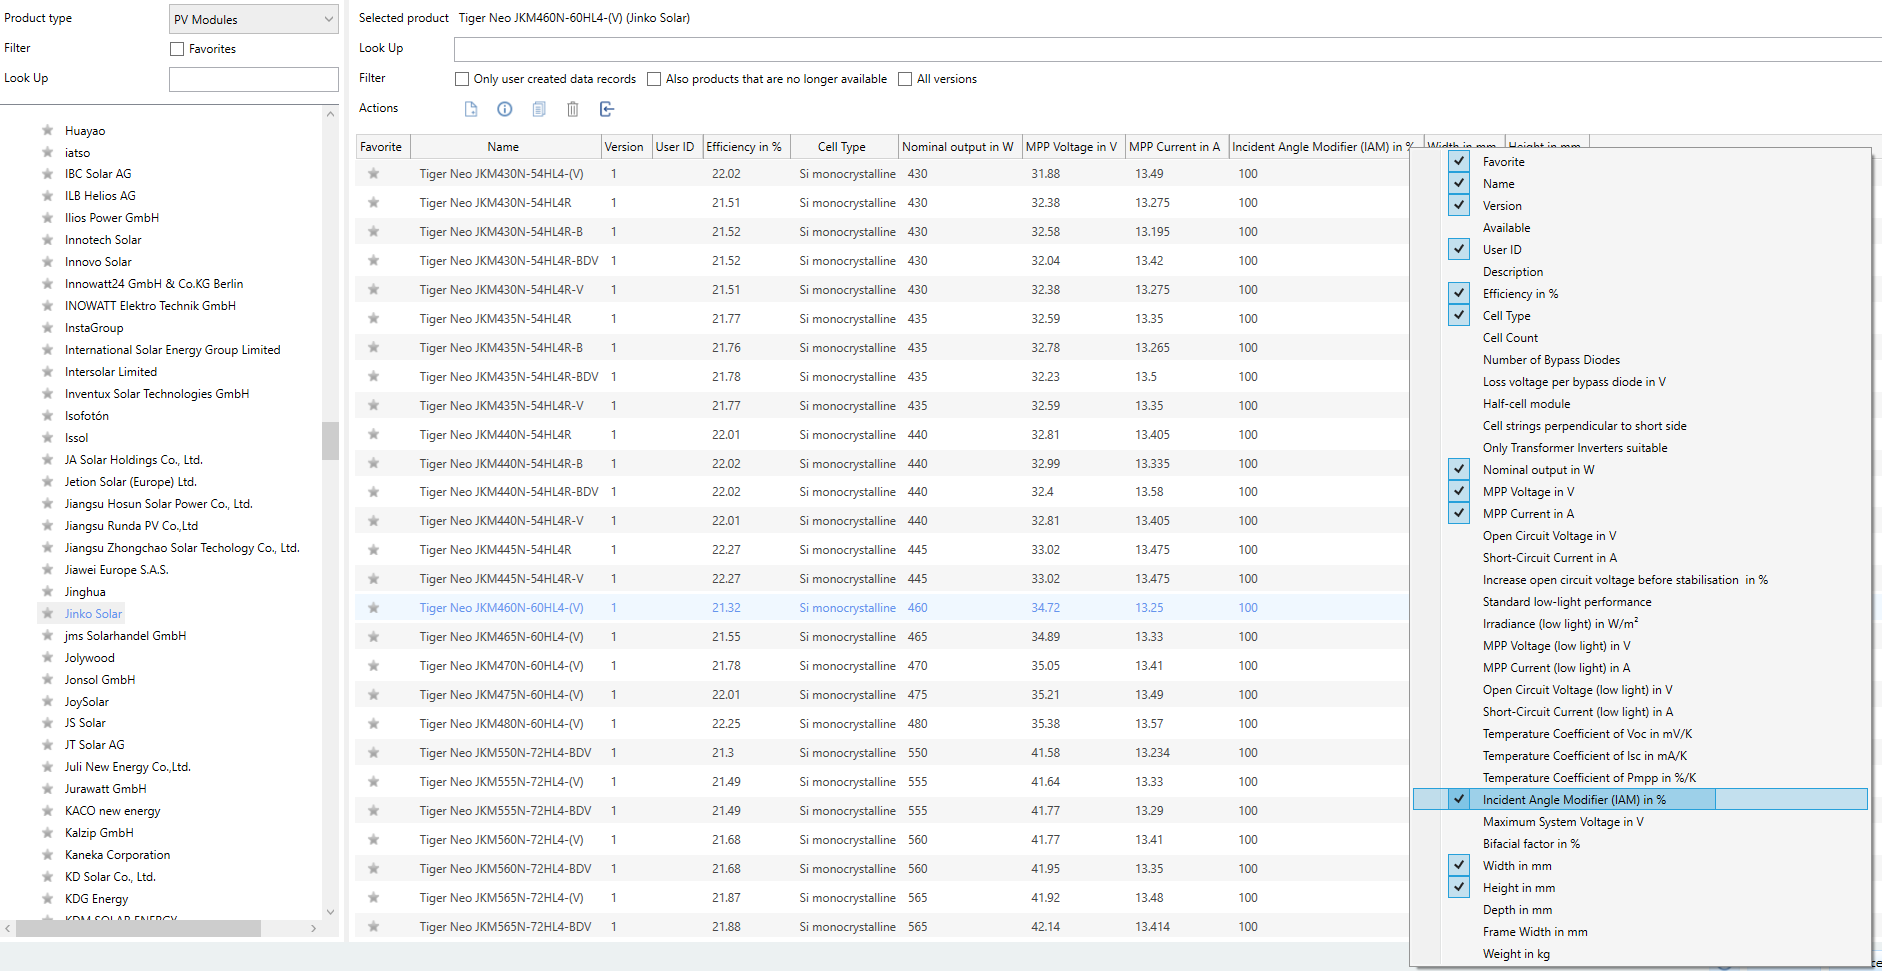
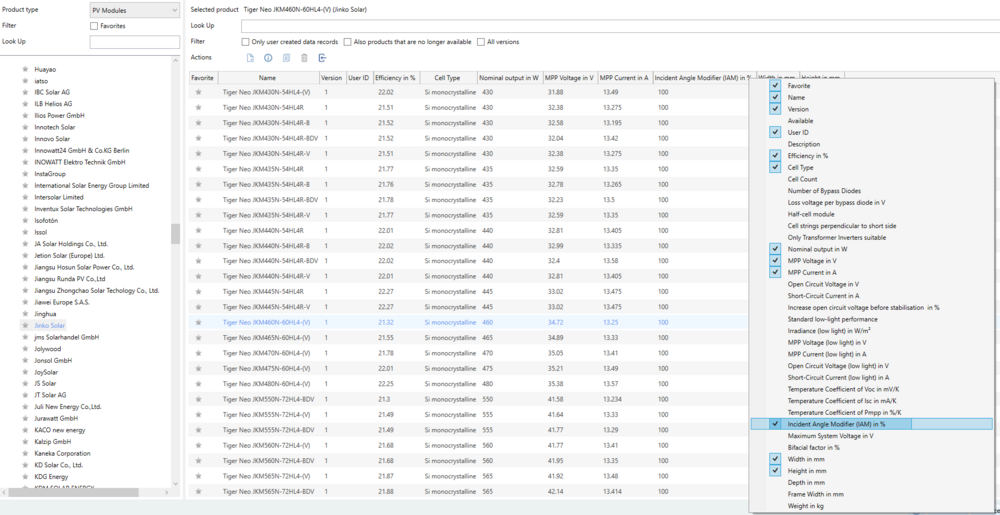
ok, so I just found out that I can add the IAM % in the 'choose module table', this already helps me out a lot with filtering unrealistic high values. it seems both Trina and Jinko solar are both having very high values in comparison to other brands.... which have a more realistic value between 0.95~0.98. Peter
-
Hi I was wondering if the Questions of Miguel already have been answered because I also would like to know. Currently I have a project whereby the subcontractor designed the PVsol and manually adjusted the IAM value ofthe module from 100% to 97% which resulted in a -4,48% reflection loss. I took the PVsyst and looked into the IAM model and indeed, according to PVsyst module data the IAM is not 1. Furthermore the PVsyst results of the system also indicate a 4.6% loss due to IAM. The subcontractor , correctly in my eyes, added this factor to guarantee the PR of the system he wants to build. 4,5% yield reduction due to IAM is fairly significant. (the PV module in question is the Jinko Solar Tiger Neo JKM565N-72HL4-BDV) *wishlist* I havent checked but if the IAM is often considered to be too optimistic I wouldn't mind to have a button or parameter box in which you can set the IAM factor. example: you can set it at 98% of the Value given in the PV module parameters. I prefer this over having to check manually if the IAM is correct and having to make a dulpicate of the panel. Hope you can clarify thanks in advance, Peter
-
Hi Jesus, If I understand correctly you think the PR is too high? Maybe you could post or have a look at the Balance of energy (balance de energía del sistema) ? Here you can see all the system losses and check if there is an unusually high or low value. hope it helps, Peter
- 1 reply
-
- 1
-

-
That solved it indeed! Seems i accidentally changed the feed in concept We are not using the financial Analysis in PvSol so I was not looking for a solution in that direction. Thank you very much Frederik!
-
Alison,, I would be interested too. let me know if you've found a method Peter
-
hi, I have an issue sometimes that pvsol doesnt show the graph of own consumption, even though. below I have the same project in another file and there it seems to work. I dont really know what is the difference between them. (the first was a 3d project but I removed the 3d check and it still doesnt show the graphs) this issue started since the r5 update, and we had this problem on several projects now Do you have any idea what it could be? do i have a setting wrong? thanks for your help Peter
-
Hi Kashyap, The difference, Isn't that what you would expect? For an EW system : For each installed kWp there would be 0,5kWp facing the east and the other 0,5kWp facing west. sun comes up in the east and shines onto the east-facing solar panel, however not on the west facing panel. As the sun moves during the day in the afternoon both panels receive sun. And in the evening only the west-facing panel. For the south system the full kWp is facing south. and would receive some sunlight all day long. When we compare both cases it seems that over the year the total electricity produced per kWp (=specific annual yield) is higher for a southfacing system than an EW system at this location. (and configuration) So if the specific yield is higher for a southfacing system, is there any reason to install an EW system ? in the case If you have limited area, for example on a flat roof, then you could install more kWp on the same area if you use EW system compared to South system. And because you can install more kWp on the same roof despite having a lower specific annual yield, your total yearly yield would still be higher than if you had chosen a southfacing system. Hope it helps you , kind regards, Peter
-
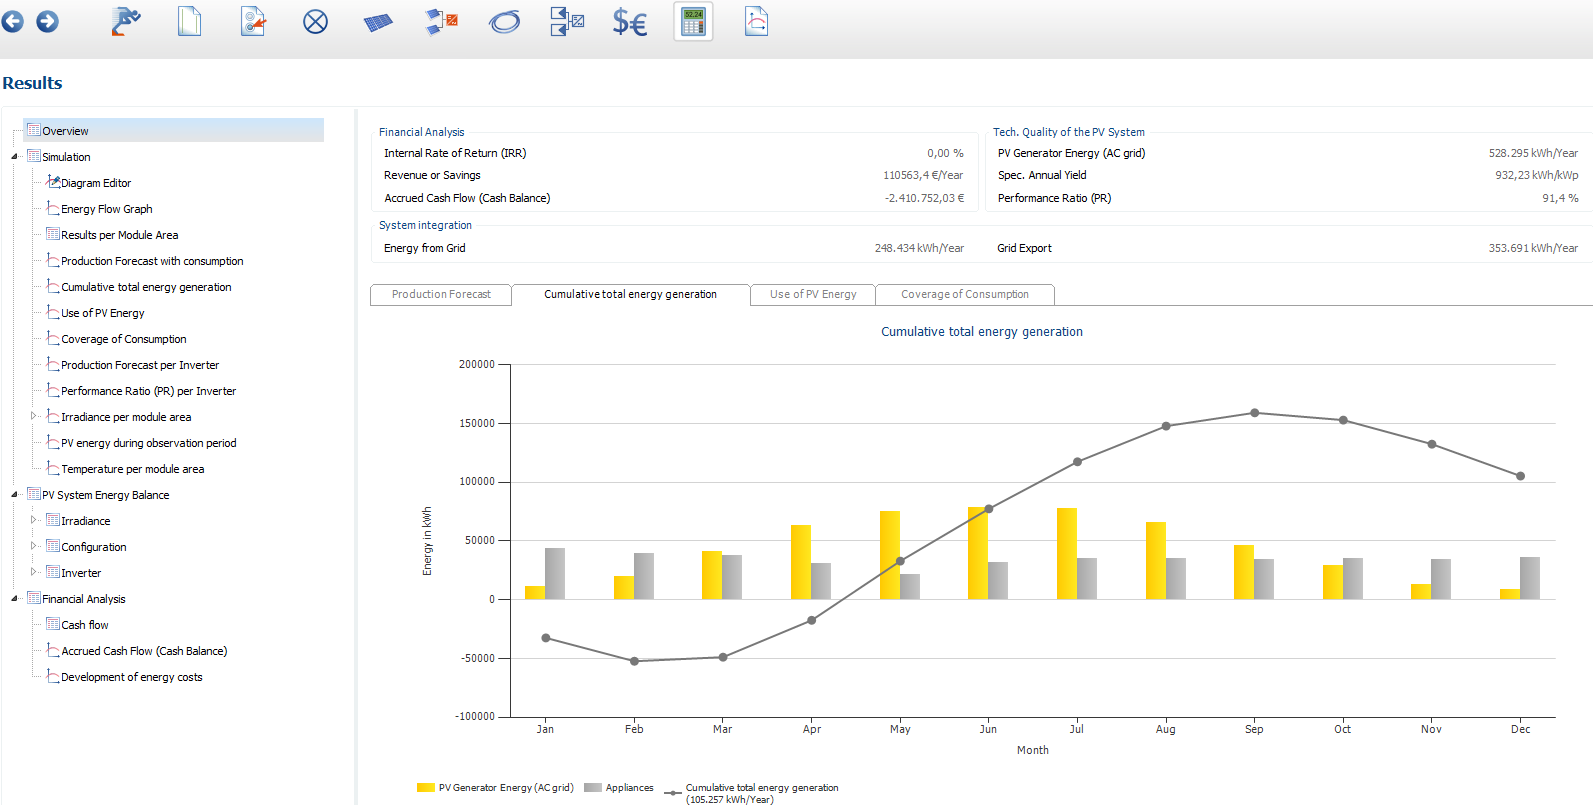
Recently we have lots of projects where there is grid congestion: situations where there is limited grid feedin (this we can model in PVSOL) but also situations where the client has higher demand of electricity than the connection can provide, limited grid export/usage so to speak, In such situations we would like to help our clients by adding solar and sometimes a battery. my question is: how to model such a system in PVsol, is there a way to limit the grid usage? or to charge a battery from grid at night for use in day? currently I would make a grid connected system, add the yearly energy usage profile + solar pv system, and then use the excel export to extract the data I need. in addition for some battery systems design: It would have my personal preference that if there is no suitable system configuration to cover the needs, instead of getting an error/ no calculation, we would still get a system calculation in which the extra energy needed still came from the grid but it would have a different name. eg. 'energy shortage' or something and a different color in the graphs, in that situation we at least have info on how much the difference to overcome should be. would love to hear from others how they approach this problem, Peter