desert_sasquatch
-
Posts
5 -
Joined
-
Last visited
Everything posted by desert_sasquatch
-
Is there a training I can take--or videos of previous trainings--to understand the T*Sol program better? Or is there a manual I should read?
-
Solar Thermal Panel Efficiency & Output
desert_sasquatch replied to desert_sasquatch's topic in T*SOL
Just a quick added note: Subsequent to writing the above I did find the option to prioritize the DHW and I deselected it. I also quadrupled the flow through the solar collectors in an attempt to prevent the collector output water from heating up well beyond the temperature of the input water temperature. And finally I made the home heating storage tank much larger and better insulated. None of it worked. It seems to have changed average panel efficiency in January to 33% from 32%, though since those numbers depend on the accuracy of my pointer's position (I'm reading it off the graph) it could in fact be no change at all. Possibly this is partly because there's no way to prioritize space heating over hot water heating in the program. Or possibly something is happening with how the temperature of the collectors is calculated that I don't understand? In visualizations the temperature of the tank often cycles constantly during the day between yellow, orange, and red--so long as one of the tanks has "yellow" water in it. Once both tanks have filled with at least orange water then it just cycles between orange and red, which sort of suggests it's illustrating something (I'm not sure what) to do with what water is being heated. But if so, is it suggesting that the yellow water is being heated to red? Is it alternating rapidly between providing domestic hot water and home heating water? Is the program just not functioning properly, perhaps because of some weird inputs I gave it? And as I was asking before, is there no way to hold the panel output temperature to something close to the input temperature to maintain efficiency? -
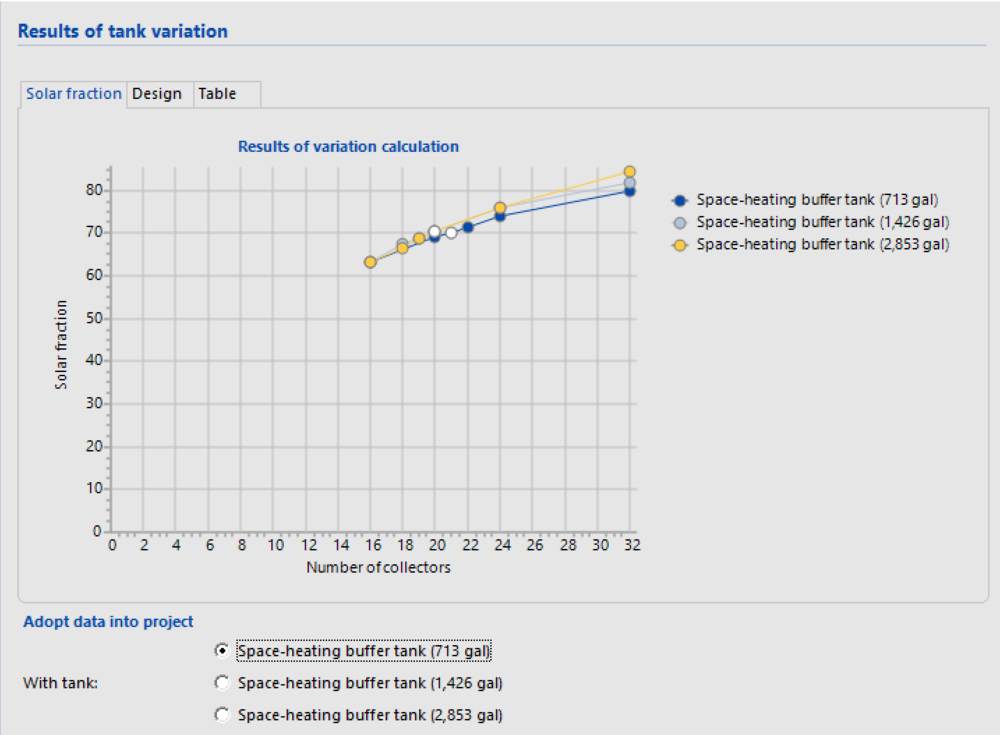
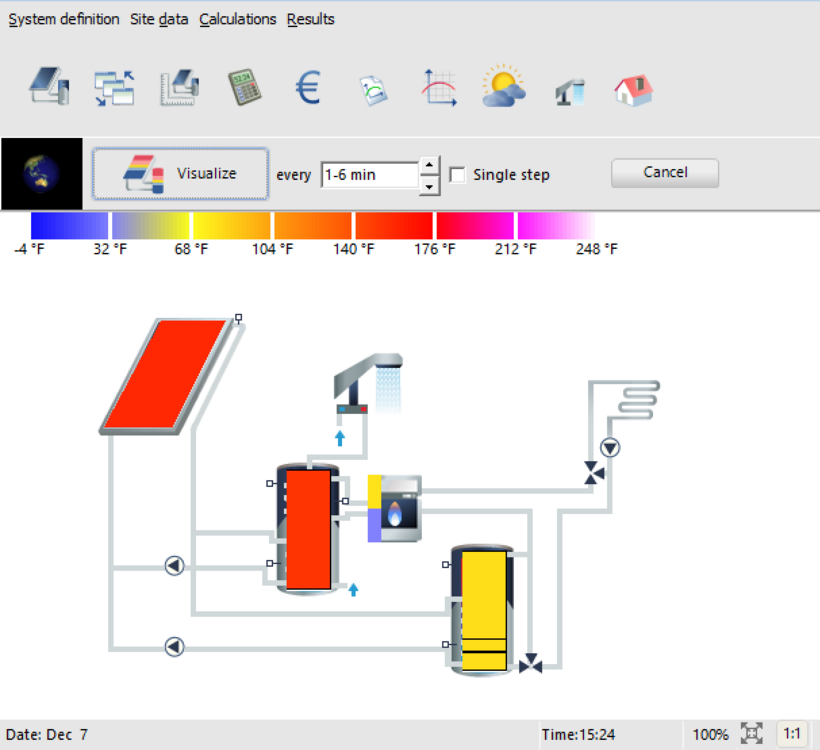
I've just got the test version of this software and it does a lot of great things. However I am running up against one issue, which is that the solar system I input seems to be underperforming by a good bit, at least when compared to my "back of the napkin" calculations. And I think I may have found the issue. So I thought I'd lay out what I'm seeing, see if someone with more experience might offer some insight and either tell me that I'm wrong or tell me that I'm right and how to use the program to account for this. The Problem When I did the "back of the napkin" math (actually it involved a rather large spreadsheet) my solar panels were efficient enough that 14 panels were enough to give me a 93% solar fraction. There are reasons that estimate could either be an under- or over- count but that's my ballpark. When I plugged my plan into the program I got this chart, however: As you can see, 14 collectors gets me a solar fraction of a little over 60% here. I'm missing a lot of energy, and because of the diminishing returns to get to the 90%+ range I'd probably have to triple those 14 collectors to 42 or more. It's possible, of course, that I just screwed up the math on my end, but I've double checked my math and I keep getting the same result, making me wonder why the program is giving me such a different one. Ballpark Estimate I should probably start by laying out my own math. The first thing I tried to figure out was how much energy one of these SunMaxx panels will produce in January (https://www.sunmaxxsolar.com/wp-content/uploads/2020/08/DataSheet-TitanPowerPlus-ALDH29-V3.pdf). Average daytime January temperatures around here could be something like 30 degrees. We get a fair number sunny and sunnyish days--lets call it 13, 10 and 8 days of sun, partial sun, and clouds, respectively. The total January DHW load is about 1000 kBTU and the total January heating load is 6000 kBTU. The tanks that feed those systems will run at different temperatures: About 122 F for DHW and 85 F for home heating. Because of thermal stratification lets say that 10 F below these temperatures is the temperature of water going into the solar panels. So January Ti-Ta for DHW is 112-30=82 F and for home heating is 75-30=45 F. We don't have SRCC performance rating for exactly those values, but we can make a guess by drawing a line between the two nearest datapoints. By doing so I get 5.1/13.6/22.4 kBTU/(panel*day) for DHW and 10.7/20/29.5 kBTU/(panel*day) for home heating on a cloudy/partly-cloudy/sunny day. As far as I can tell, that means that 14 panels will usually produce more heat than I need on most of the sunny and partly cloudy days in January. Obviously there's some variation there, and trying to store extra heat results in a higher temperature for the heat bank, which results in lower efficiency. But if the heating needs were approximately equal on every day of the month, those 14 panels would provide probably 80-90% of my heating needs. Yes, that number will go down a bit because of the worst days where the temperature drops and snow covers the panels. But that might happen once or twice in January, and almost always snow on a tilted south-facing panel will be off in a day or two. As an example: A partly cloudy day with average daytime temperature of 30 degrees F. For domestic hot water, each panel produces about 13.6 kBTU/day. For home heating each one produces 20 kBTU. If four of the panels are used for DHW and ten of the panels are used for home heating that's 4* 13.6=54.4 kBTU for DHW and 10*20=200 kBTU for home heating on that on that day. If I'm projected to need 1000 kBTU for DHW and 6,000 kBTU for heating in January then on an average day I'd need 32 kBTU per day for DHW and 194 kBTU per day for heating. So on that partly cloudy 30 degree day my solar fraction would be 100%. (If you're wondering if I should be taking the irradiance values in the SRCC chart as constants in spite of the fact that it's winter...I shouldn't be, I don't think. But in my location I will get 95% of those values so...close enough, I say. Everything below this is corrected for 95% irradiance compared to the SRCC tables). Using similar calculations I find that on a 30 degree cloudy day I'd manage 142 kBTU of home heating from the panels--and none for DHW. That's still not too bad; solar fraction is 63%. And as I said, that's for the worst month. At least 2/3 of the months will be significantly more friendly to this system since the space heating demand will drop and the outdoor temperature will rise. So my guess is that almost all of the non-solar heating will occur in either December, January, February, or March. If that's true, then to reach 90% solar fraction for the year as a whole I would only need to achieve 70% solar fraction for those four months. So on my worst month with 14 panels it looks like my solar heating fraction will be 80% or more (I admit that depending on how many "0% solar fraction" days there are, 80% could be optimistic--but I'm familiar enough with snowfall patterns here that I feel confident saying that the panels should only be covered by snow a few days of the month--call it three days or so in January. So maybe we take another 10% off of the 80% estimate and we come to 70% solar fraction for the worst months. That's still dead-center on what I need to achieve a 90% solar fraction overall using just 14 panels.) So how is it that I and T*Sol are so far off in our estimates? I have a few thoughts Solar Fraction Includes Electric? I don't think this is the case, mostly because if it were then the lines in the graph above would level off below 100%. To my eye that's not the case but...eh, I'm not a professional here. Wind Chill My estimates don't include this. The location data is from a place that probably has some wind. My actual location doesn't have this problem so much but maybe T*Sol wouldn't know that. Still, if wind was a really big issue it seems like there should be variables for how much a person has protected their panels from that wind. I don't see those options so I kind of assume it's a minor issue. Unnecessarily High Solar Panel Operating Temperature This is what I think it is. The idea is that T*Sol is forcing the solar thermal panels to run at the temperature necessary to supply DHW all the time (ie even when it's supplying home heating water). On a cloudy/partly-cloudy/sunny day that would reduce output (measured by SRCC Performance Rating) by 52%/32%/24% for the space heating portion of the equation. (That's a weighted average of 38%). As best I can tell the 38% efficiency drop means the panels would go from about 60% efficient to about 37% efficient. That not only approximately accounts for the shortfall in heating capacity that I'm seeing, but it might explain why T*Sol thinks that the average panel efficiency in January was only 32%; 37% minus three snow days of 0% efficiency would get us to 33% efficiency which is more or less within spitting distance of the 32% efficiency T*Sol estimates. Unfortunately this estimate is a bit loose because the 60% figure comes from the ALDH29 efficiency curve graph but the numbers come from the SRCC performance rating, and they don't match perfectly. Additionally, I ran the visualization and it appeared to confirm this hunch: On winter days the solar panels in T*Sol got up to the orange or red temperatures (140 F or 150 F maybe?) on some days. When the panel was in the red the home heating tank would increase in temperature somewhat, but each time I watched this, the temperature was insufficient to keep the home warm throughout the night--in other words I know that the water was not just allowed to reach those high temperatures because the home heating demand had been achieved at the lower temperature). So to me it looks like I'm getting these results because T*Sol is not varying the flow rate with the panel output temperature in order to prioritize lower-temperature output before DHW and in fact is using the water from the panels to heat domestic hot water and the home equally. Perhaps in this design there is now way to shunt water towards DHW or home heating? I'm new to all this so my knowledge of the various valves and such is pretty limited but it seems like I've seen a few three-way connections that are able to direct water one way or another depending on the temperature of said water. Seems like something similar could be used here, but it's not, at least not in this design? Here's a photo, in case it helps: Question Do folks think I'm right about this or is there another reason that the panels are much less efficient than I'm imagining them to be? Heck, is there a reason that my general idea about higher efficiency when heating the home is wrong? Isn't this a thing that people do, or have I misunderstood some basic principle? Is there a way to set up my T*Sol variant so that the solar hydronic panels operate with the minimum required Ti-Ta until the space heating needs have been met, and only then switch to the higher temperature? In other words, can I set the panels to put out 90 F water for space heating until I've got about a day's worth of heat saved and then switch to 122 F water until the DHW tank is hot enough, and then if there's excess energy, use it to heat the space heating tank? Thank you.
-
Perfect, thanks!
-
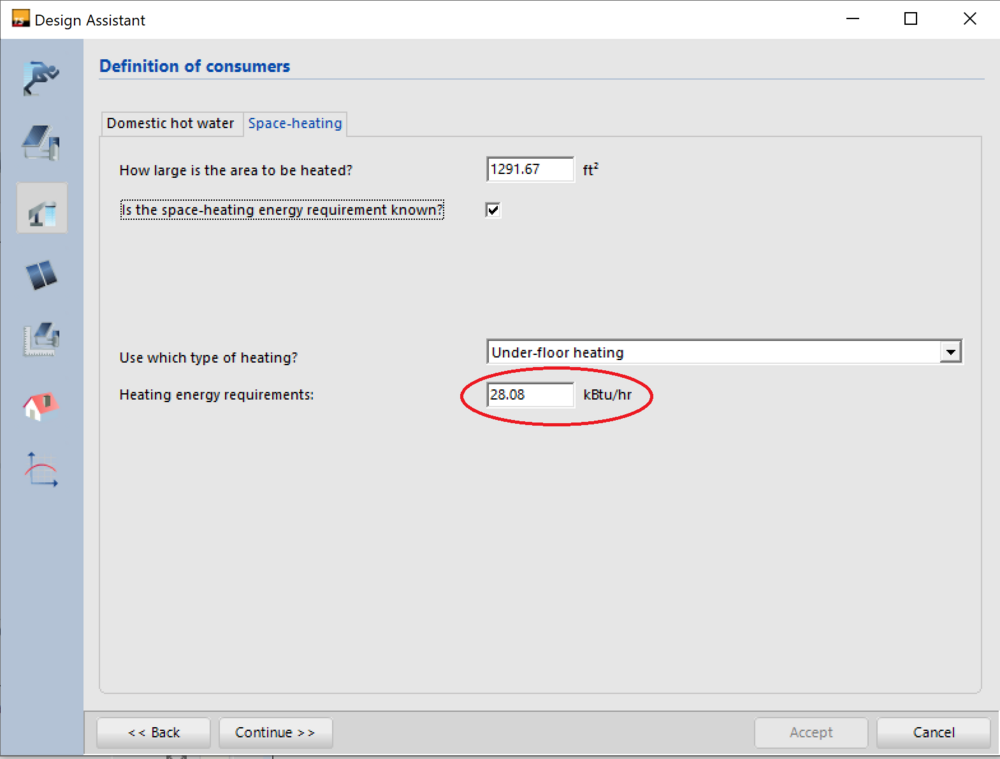
This is a small question, and if there's some place I could have been looking (documentation?) for the answer instead of bothering folks on here please do let me know. I'm trying to model a system that uses solar thermal for space heating as well as domestic hot water. I'm currently trying to do this using design A3.2 (DHW system with heating buffer tank and external heat exchanger). I clicked on the design assistant. I click on the definition of consumers tab on the left. Then I click on the space-heating...lets call it a sub-tab under where it says "definition of consumers". There's a check-box where it asks if the space heating energy requirement is known, and I click on the check mark because yes, it is. The bottom box asks for heating energy requirements, in this case in BTU/hr. That's where I'm unclear. What is the context of this? Is this my average heating requirement for the whole year, expressed as kBTU/hr? Is it my peak heating energy requirement on the worst day of the year? Is it the average requirement for the worst month of the year? Thank you