


Aleksandar
-
Posts
7 -
Joined
-
Last visited
Aleksandar's Achievements
")


-
Hi, I have one project where client want to fill all avalibe roof space with PV panel. Included North side. With the calculation through the software for that north side, I get a somewhat excessive calculation for the production of the panels that are located in the north. Is that correct or? Prjocet file in attachment. Through some of my manual calculations, I get that thanks to those panels located in the north, the total annual production from complete PV generator should be around 9000kWh per year. And the software gives about 12000kWh. Can you check this calculation. Eschborn.pvprj
-
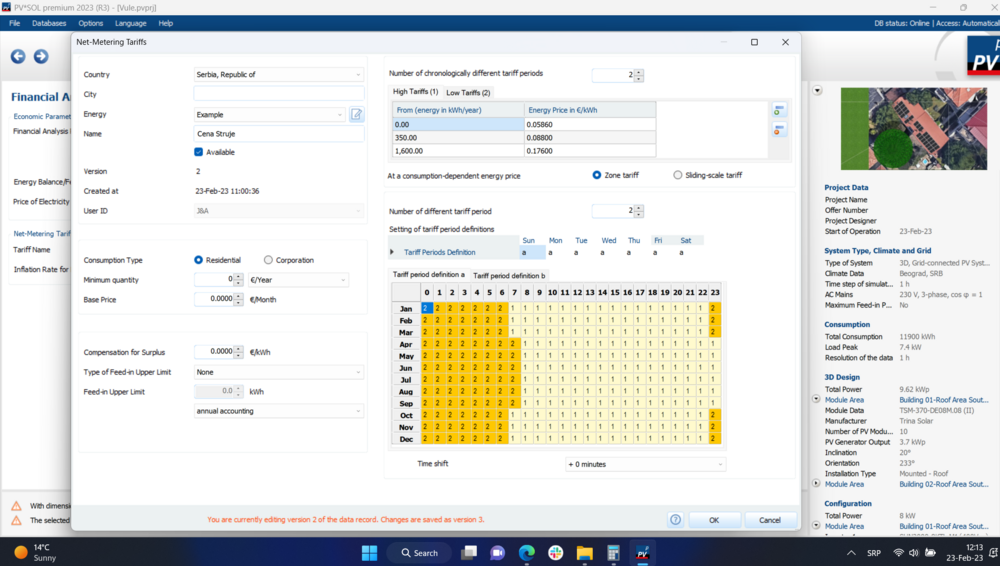
Hi, I have question. Is posible make tariffs zone on usuble energy. Example in one mont. In Serbia. We have three zone. 1 Zone is Green. 0-350kWh, 2 Zone is Blue 350kWh to 1600kWh 3 Zone is Red 1600kWh to infinty. For every mont conunter is reset. For me, I need is posible create this zone per mont. From kWh/mount. In option here is onlz kWh/year. In one day we have also High and Low price per kWh. High is active on day. Low is active in night. How to can make correct calculaction. Please see pitchure and archive file in attachment. Best Regards Vule.pvprj
-
Hi PV Sol team. Please is posible you can give me link where can donwload previous version. Becaus, I have to submit documentation for a some project.
-
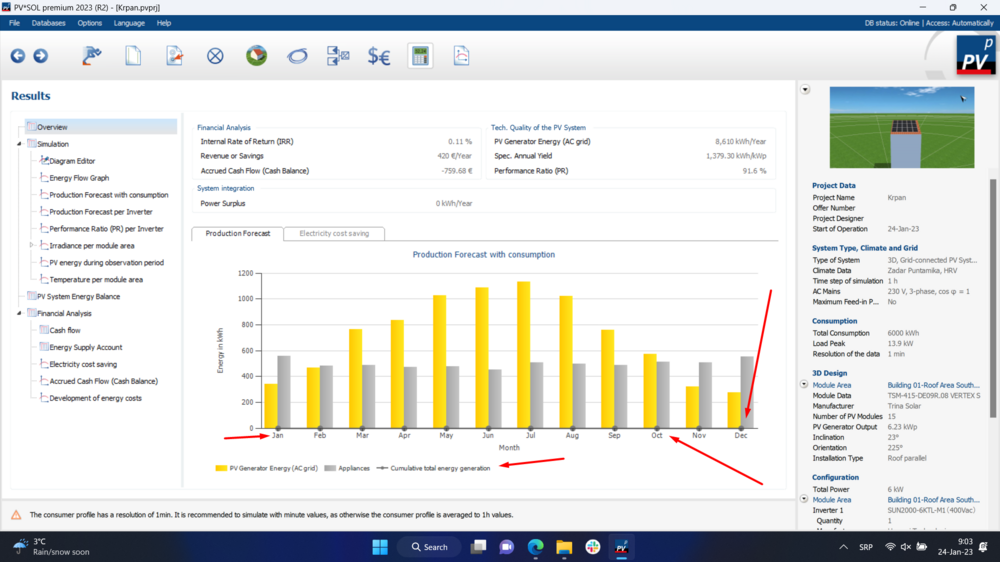
Hi I have a problem with curve on net-metering report. I don't understand why cumulative total energy generation curve in report constant 0. And also solar fracion, and level of self-sufficiency 0%. Please see pitchure belowe, and can finde in attachment project file. Krpan.pvprj

-
Thank you for the clarification. Can you tell me if it is possible to somehow simulate charging the battery at night with cheap mains electricity
-
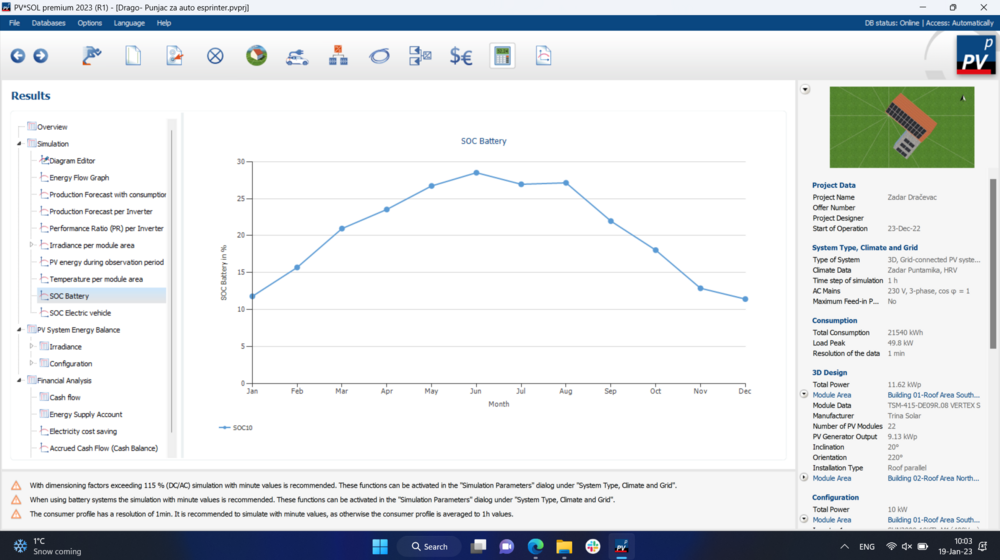
Hi Martin, Thank you for answer and explanation. Let me see if I understand your simulation correctly. On the simulation, it is marked in red when the batteries are 100% full. Or does this mean that when it is red it is charging at maximum capacity? Is there any way I can run this simulation through PVsol? I was confused by the diagram from the pictures below. Where it tells me that the SOC of the battery in the summer periods is below 30%. So what exactly does this diagram in the picture represent? And where before directed energy I have in batteries according to the energy flow about 5000kWh per year.
-
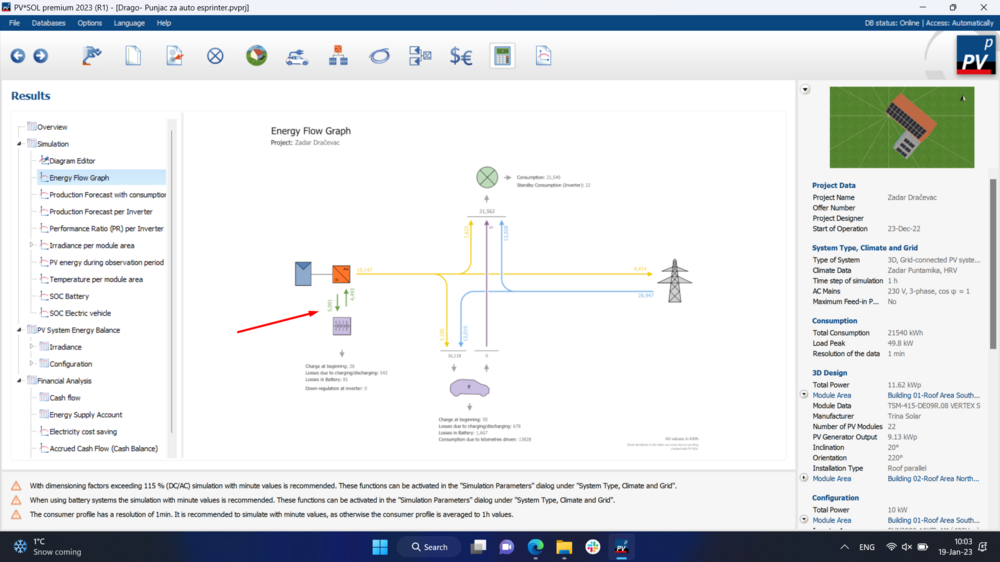
Attached is a project. Which has 11.62kWp panels installed.Inverter, 10kW. Batteries 25kWh. And also a charger for the Mercedes esprinter Van. My questions are as follows: 1. How to set the minimum SOC level for batteries to 10%? 2. How is it possible for the SOC of the battery to be filled in such a small percentage. How is this calculated? If you look, it barely exceeds 30%. How is it possible that in the month of July, where the production is about 65kWh per day. Can't charge 25kWh batteries? Up to say 100%. Our whole idea is to store excess energy during the day in batteries in order to charge them as much as possible. In order to draw electricity for the charger from them at night. How could we achieve this? I would really appreciate it if you could take a look at the attached archive. And give me a suggestion based on it. Project1.pvprj


