developer_bh
-
Posts
60 -
Joined
-
Last visited
-
Days Won
8
Everything posted by developer_bh
-

Help to understand weather data from PVGIS
developer_bh replied to Asger Kappel Skau's topic in PV*SOL
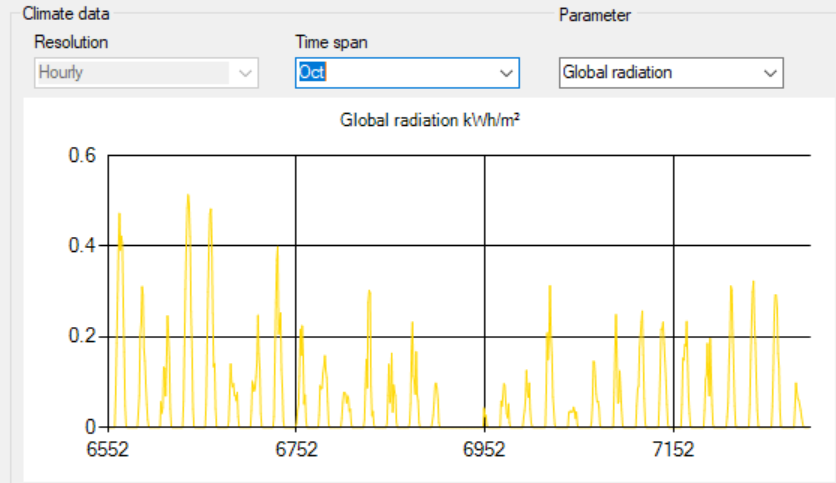
Let's put it that way : It is not uncommon for PVGIS. But not all locations have flaws fortunately. They try to improve so it is still good to look at each location for anomalies and to reevaluate when a new version is out (f.e. PVGIS 5.3). Main things to consider are: missing GHI data unnatural GHI data missing temperature data offset in sun-course with GHI data The best way to dive into wbv data before the simulation started is the MeteoSyn Details view at the moment. The sun position is calculated afterwards and not included in the weatherfile. However it is based on timestamps in the weatherfile. You can also do a database-sanity-check in MeteoSyn and put Phase I to mode "Expert". In the following dialogue you'll see "findings" of the weatherfiles in your database. The current problem you mentioned here will not be detected yet. You also have the possibility to copy the simulation-results data into a table, f.e. paste it into Excel.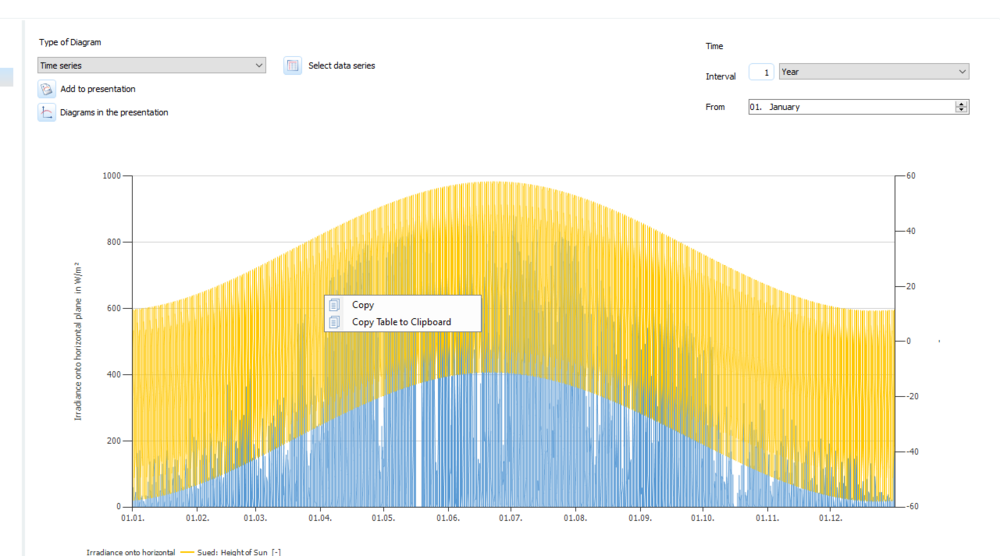
-
Help to understand weather data from PVGIS
developer_bh replied to Asger Kappel Skau's topic in PV*SOL
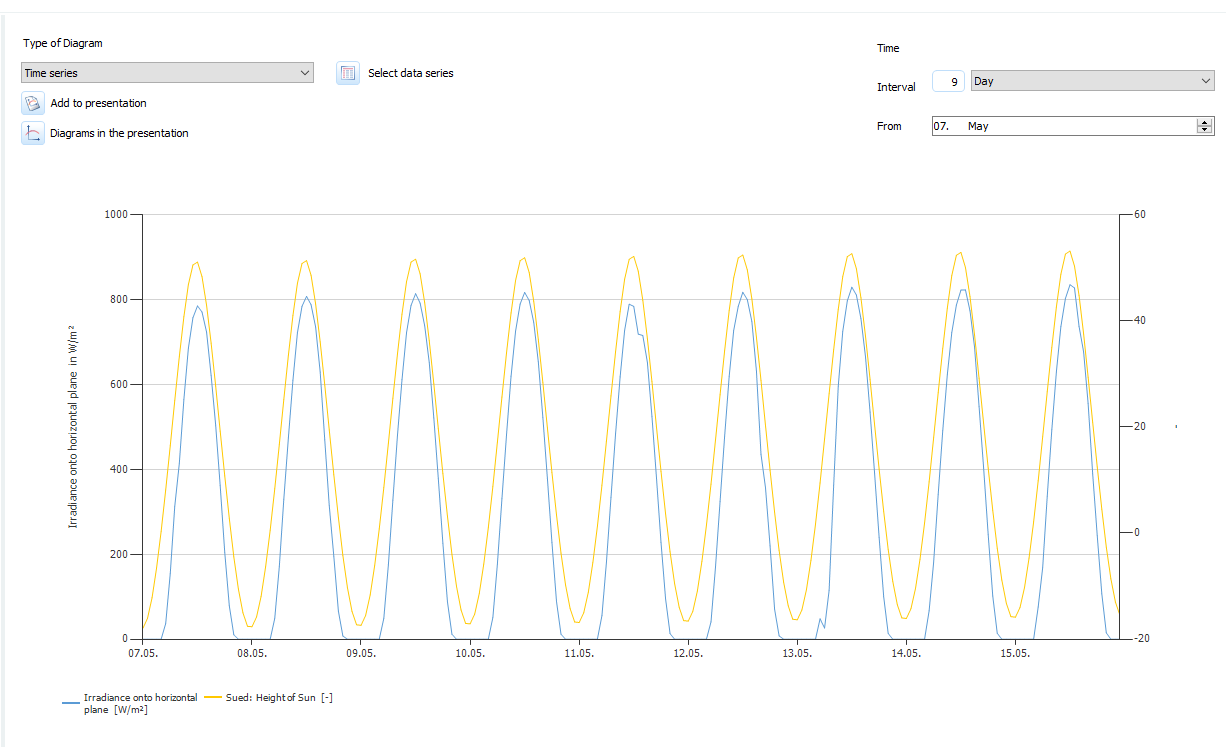
Dear Asger, today I further investigated your issue. The problem is that PVGIS has an offset in their timestamps, that the sun-course over the day does not match with the GHI data. You can see it for example on 14th of may in the picture below. That leads to an higher, unnatural GHI peak towards the end of the day. We try to further improve our precheck when fetching the data to prevent downloading these locations. Best, Ben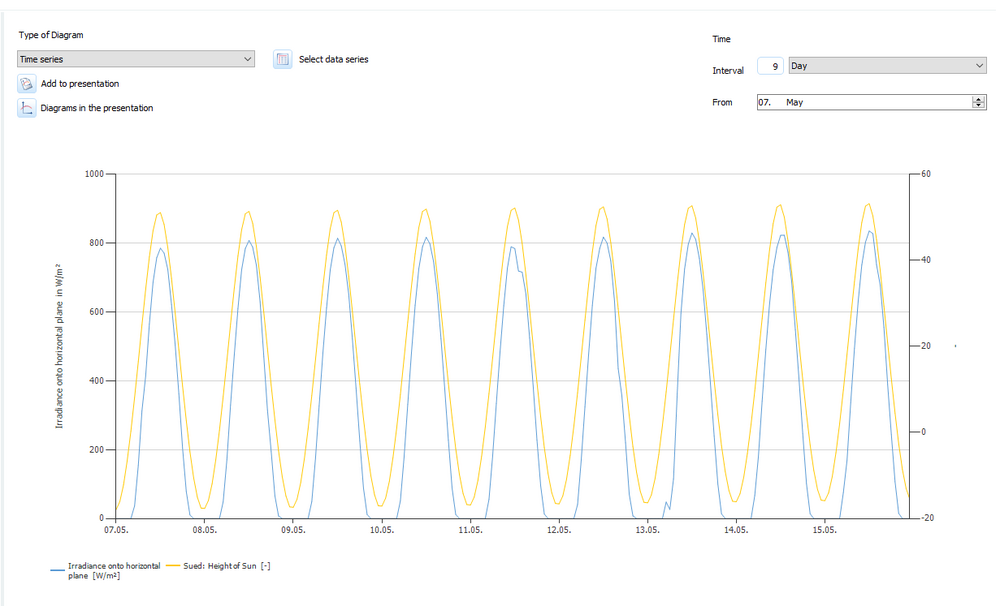
-
Help to understand weather data from PVGIS
developer_bh replied to Asger Kappel Skau's topic in PV*SOL
You have a notice in the MeteoSyn-Location-Details view about missing periods of GHI data. If you use this location this will be treated as no GHI for this period. Best regards, Ben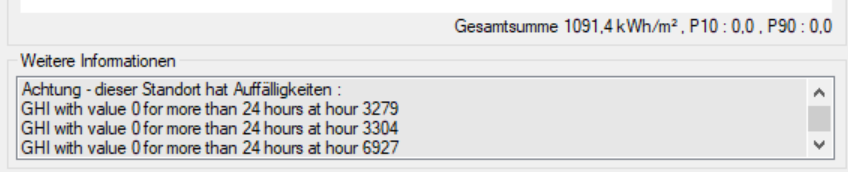
-
Help to understand weather data from PVGIS
developer_bh replied to Asger Kappel Skau's topic in PV*SOL
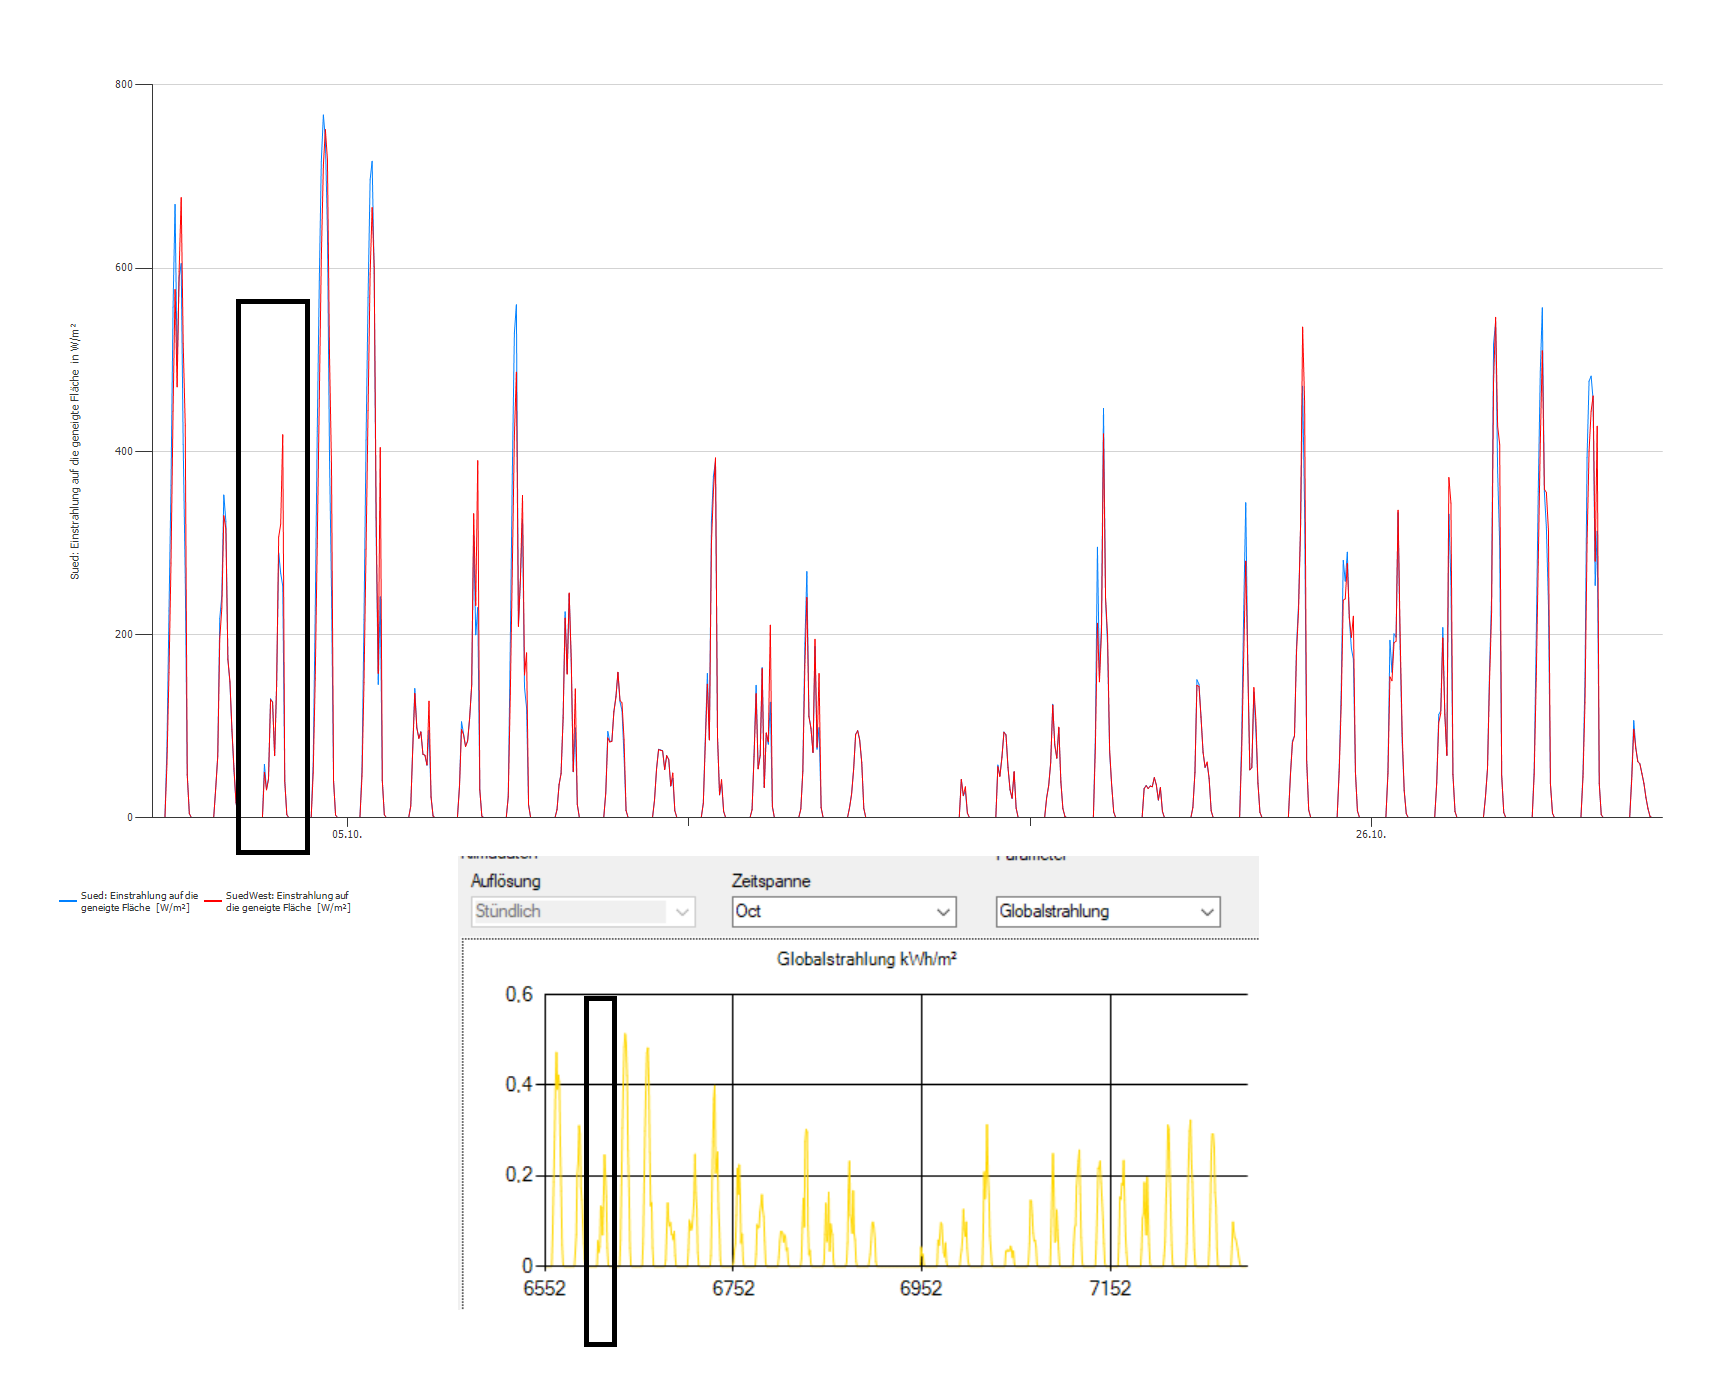
The high west value most probably comes from PVGIS data with irradiation peaks at the end of the day. Although this is no pattern which is as obvious as in my first response, you can still find those peaks in the PVGIS data. For example on october third you have higher global-radiation at the end of the day (black square) resulting in higher irradiation on the south-west pvmodule (red) in comparison to the south-pvmodules (blue). I did not investigate the whole year and did some maths on it due to limited time, but I'm pretty sure this is the reason.
-
Help to understand weather data from PVGIS
developer_bh replied to Asger Kappel Skau's topic in PV*SOL
Dear Asger, thanks for sending the project! The weatherfile used in the project is different from what you sent previously. The weatherfile in the project has at least two flaws : it has missing data in may and october. I guess this is the reason your project has these irregular results when using PVGIS. Hope this could help you? Best, Ben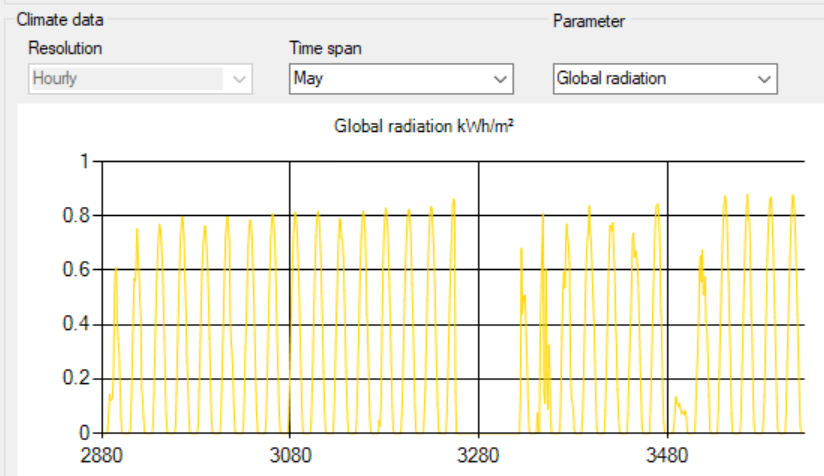
-
Help to understand weather data from PVGIS
developer_bh replied to Asger Kappel Skau's topic in PV*SOL
Yes would be interesting indeed. You can click on my profile name and then you will find a button "Message". -
Difference in PVGIS and meteonorm weather data on production
developer_bh replied to hom's topic in PV*SOL
Dear hom, thanks for reaching out to us. Does the monthly distirbution of global irradiation values look similiar to your chart for this PVGIS-location (You can see it via MeteoSyn > Details with the latest PVSOL) ? Sometimes there are missing timeperiods in the data, so I'd recommend to check your climate-data-file in MeteoSyn for missing periods, f.e. days with no global radiation at all. If yes and no missing timeperiods: As Mikio already pointed out there can be some irregularities in PVGIS data. These mainly regard temperature data on locations near the coast . In PVGIS 5.1 and older (called PVGIS-SARAH/ERA-Interim" in the source) there can be some more problems regarding the distribution of the global-irradiation data over the day. However your problem does not look like one of these factors. It might be a problem with the satellite-rawdata which is collected to generate a typical meteorological year. It is hard to reconstruct at this point why April is higher than May and June, we don't have the raw data from PVGIS. If you want to investigate yourself you may have a look at https://re.jrc.ec.europa.eu/pvg_tools/en/ . For now I'd recommend using another climate source for your area. Best regards, Ben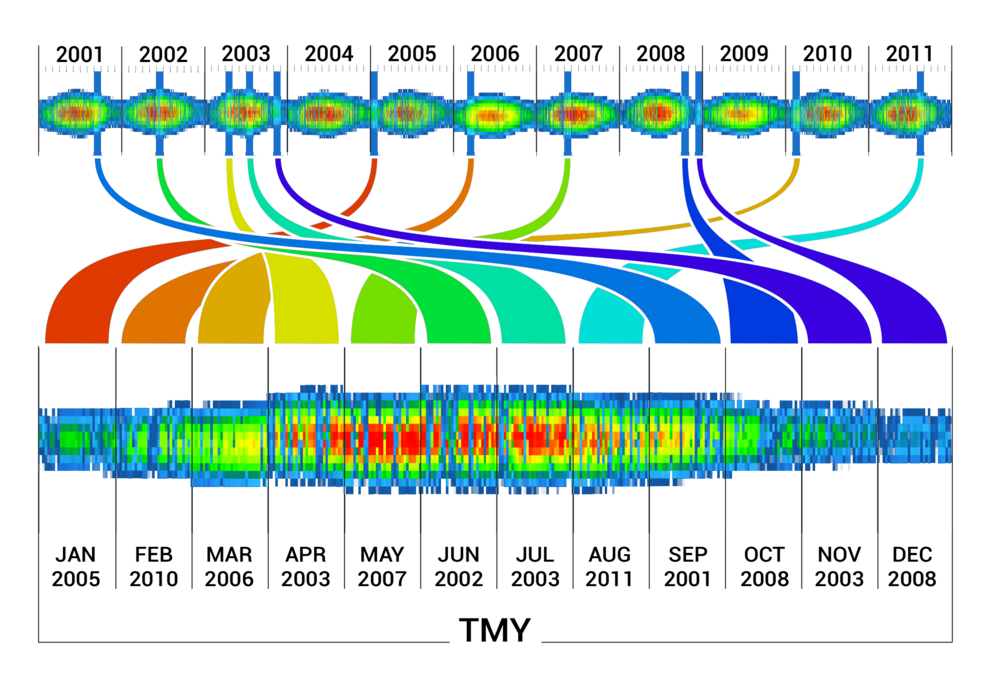
-
Help to understand weather data from PVGIS
developer_bh replied to Asger Kappel Skau's topic in PV*SOL
Hello Asger, thank you for your answer! PVGIS 5.1 has a timerange from 2005 to 2016 and is called "PVGIS-SARAH/ERA-Interim" in the source. PVGIS 5.2 has a timerange from 2005 to 2020 and is called "PVGIS-SARAH2/ERA5" in the source. So your file is PVGIS 5.2. That means that my first theory of wrong data towards the day-end does not apply here. The daily course of irradiation data for Slagelse looks plausible : It would be helpful at this point to have a deeper look into your project. You may send it to me via PN if you wish. Best regards, Ben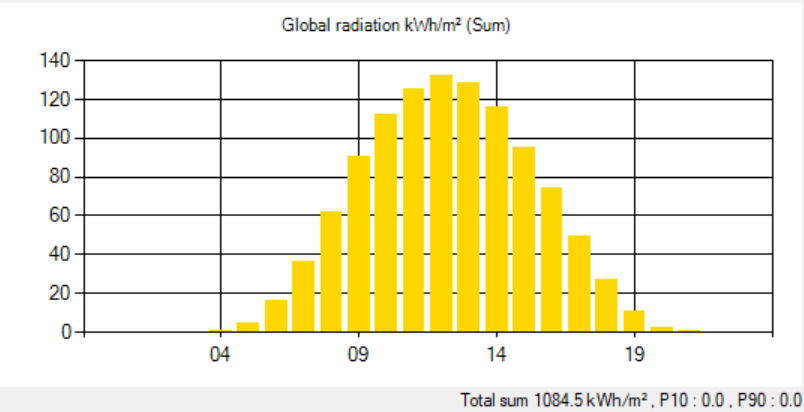
-
Help to understand weather data from PVGIS
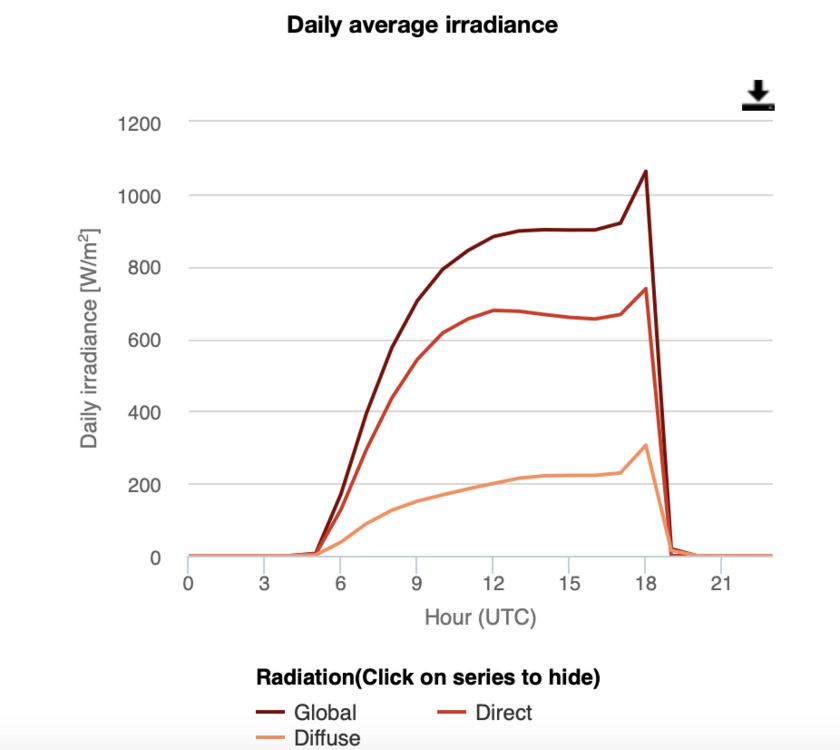
developer_bh replied to Asger Kappel Skau's topic in PV*SOL
Hello Asger, thank you for your feedback and for taking the time to report this anomaly in the climate data to us! I agree with you that a higher value of Southwest values compared to South values lowers the confidence in the climate file. I am guessing that you are using a PVGIS file version 5.1 or earlier? Specifically, your problem is most likely an unnatural distribution of global radiation values towards the end of the day (sunset), which is why the southwest orientation has elevated values. PVGIS is aware of the problem and claims to have solved it with version 5.2. In the following graph you can see such an unnatural peak at the end of the day. If you could send me your climate file I could investigate the problem further, which would be very helpful in proving the thesis and taking preventive measures if necessary. You can send me the file via PN or upload it in this thread. Until further clarification, I would recommend that you use alternative climate data for this location, for example from Meteonorm. Best regards, Ben