Gejege
-
Posts
5 -
Joined
-
Last visited
Gejege's Achievements
")


-
Of course, I'll send it over now.
-
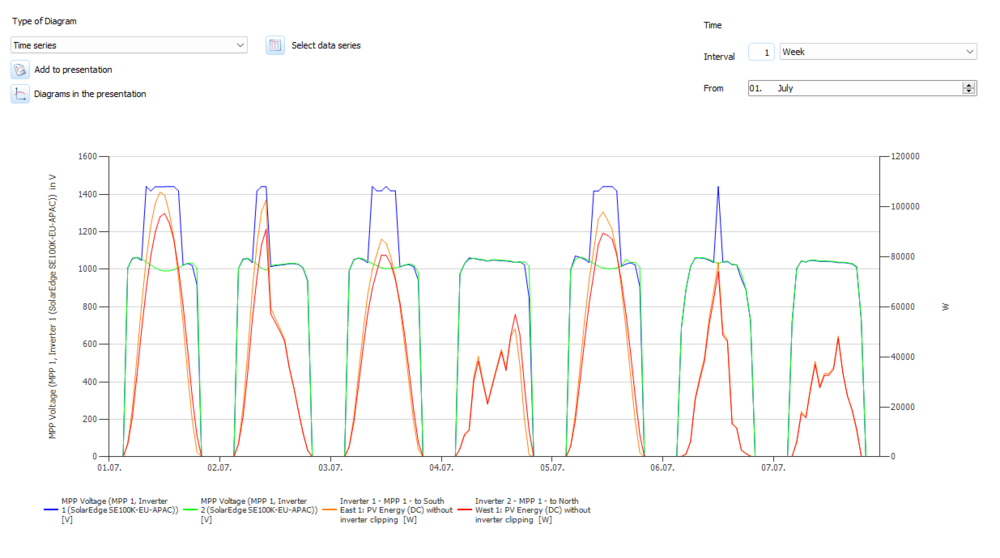
I am running a simulation for a SolarEdge simulation using detailed cable losses and I am seeing some strange results when plotting the MPP voltage graph. Example graph below, I have two near identical inverters with near identical strings, the only difference is one has 10m of string cable per string, the other has 200m of string cable per string. Why would the system be spiking at over 1400V when the losses are higher? This only occurs as the string losses increase, as when I set the DC cable to something large like 25mm2 the voltage spikes are eliminated. Any ideas what is happening? Thank you,
-
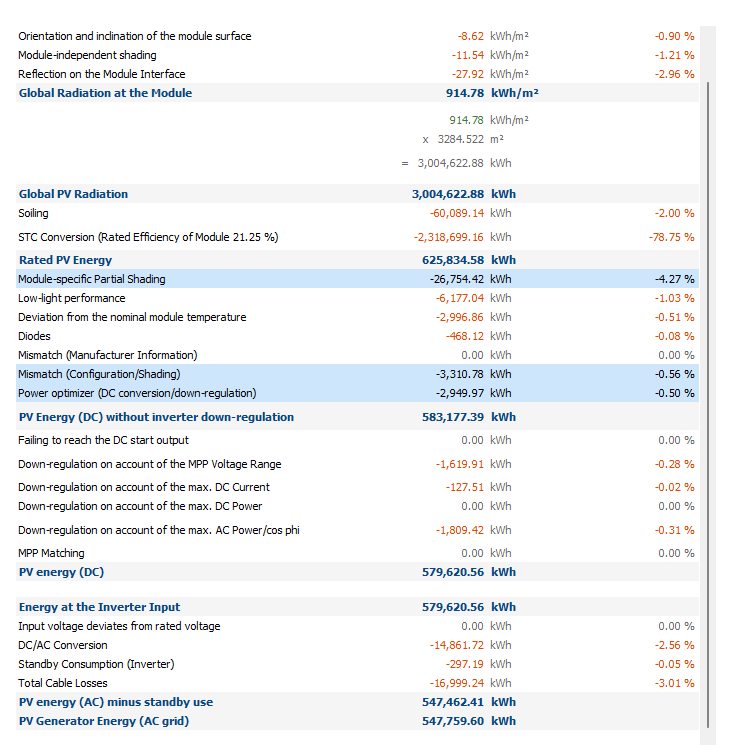
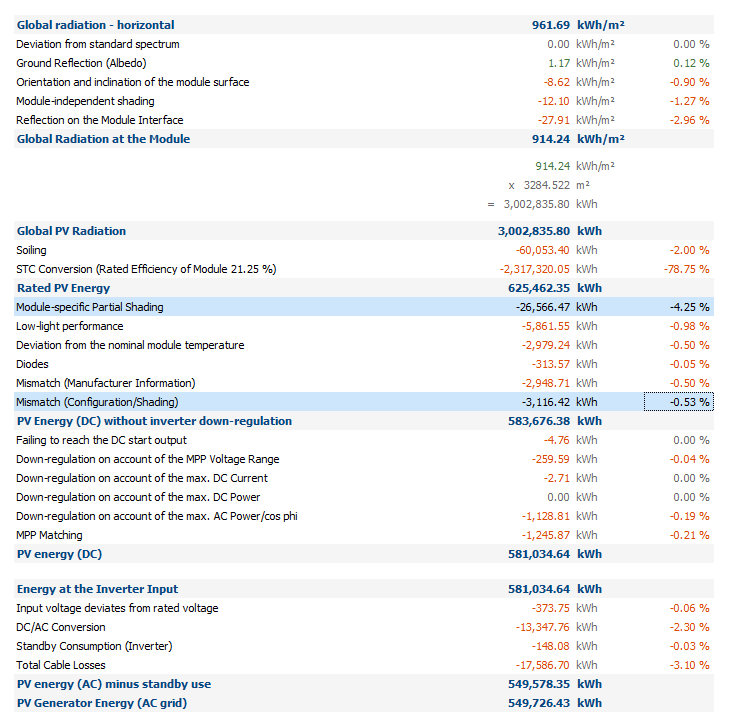
I am running a simulation comparing a Huawei system to a SolarEdge system with near identical panel layouts, and there is a fair amount of shading on certain sections of the array. I would expect SolarEdge to outperform Huawei, however not only does it have a lower kWh yield, it also had a higher Mismatch (Configuration/Shading) loss? Is there anything I'm missing? I can't get my head around how this is the case. SolarEdge losses below, with 0.56% mismatch losses. Huawei simulation, with only 0.53% mismatch losses? I also ran a Huawei option with a few TIGO optimsiers and this reduced the mismatch losses to 0.40% which makes sense, I just don't understand how SolarEdge is performing so poorly. Thank you.